Showing posts with label David Farrar. Show all posts

Friday, 22 February 2013

Regional heterogeneity

You can hide a lot in an aggregate.

David Farrar rightly notes that the recent CERA / Nielsen survey weighted survey responses by district populations across Christchurch City, Greater Christchurch, Selwyn and Waimakiriri. So some reports suggesting the report masked things by weighting each of Christchurch, Selwyn and Waimak equally were wrong.

But there's a potentially much bigger masking of heterogeneity.

After the earthquakes, Christchurch turned quickly into three cities, as Peter Hyde put it:
When we got power back on a week after the February earthquake, I sent out an electronic plea for more direct support and attention for the worst-affected suburbs of Christchurch.
This was in response to the "three cities" I saw developing - Rescue City in the photogenicly-ruined CBD, Shower City in the areas which had their services largely intact, and Refugee City where tens of thousands huddled amongst broken houses, rockfall and liquefaction.
When we bugged out from South Brighton for a house in Wigram on the Friday morning after the quake, it was like moving to another world. There was power. There were supermarkets. People were watering their lawns despite the sewerage system being in disarray. It was as though nothing had ever happened, barring a few chimneys. A lot of the East remains a rather thorough mess two years later.

I remember answering the CERA survey. I don't think I counted as a satisfied customer.

If you look at Appendix 2, every respondent was mailed the survey along with a username and unique survey code. So each response was tied to an address, unless they chose to blind the back-end so they wouldn't be able to tie respondents to addresses. They also had a question in there asking what address you were at prior to 4 September if you'd moved since the quake. That question says
"Please note: this information will only be used to see if there are differences between different areas. Your individual information will not be looked at separately."
Maybe they only ever wanted to aggregate up to Christchurch City, Greater Christchurch, Selwyn District, Waimakariri District level. But the data should be there for doing a within-Christchurch disaggregation. I'd be very surprised if there were not exceptionally strong heterogeneity between Shower City and Refugee City. Maybe nobody ever ran the borough-level analysis. Or maybe not - I really don't know.

If Lianne Dalziel is on her game, she'll already have an OIA request in for the data aggregated by borough. And if it shows that residents in the East - those most affected by the quakes - have reported utter dissatisfaction with quality of life, quality of government response, and pretty much everything else, I'd be pretty surprised if she weren't very vocal about it.

Happy two year anniversary, #eqnz.

Wednesday, 24 October 2012

Labelling and non-tariff barriers

David Farrar asks why we shouldn't mandate nutritional labelling on alcoholic beverages. People may well forget that alcohol has caloric content; providing information has value.

Here's the case against them.

First, it is fairly easy for large producers of homogeneous products to add nutritional labels to their products. The one-off testing and label re-jigging is a fixed cost that is spread across a very large number of units. But, suppose you're a craft brewer and you get a notion to make a seasonal autumnal ale with pumpkin in it. It'll taste good and sell well as a small batch. But after you make a batch, you're going to have to send a bottle to the lab for testing, wait for the results, and attach the appropriate nutritional label to your new brew. This will add maybe a fortnight or more to your brewing cycle on the first batch of the product and cost you a bit in testing. You can't spread those costs over many units because you're not making many units. And heaven help you if you decide you should double the pumpkin in the next batch.

Second, it's a non-tariff barrier against imported products made in countries that do not have labelling requirements. When New Zealand implemented labelling requirements for standard drinks a few years ago, the shop where I bought my oddball foreign grey market craft beers had to print off little labels for each bottle of the one-offs that they sold, converting the percent alcohol content into a number of standard drinks. This added to the cost of foreign craft beer relative to domestic or mass market product.

You will rightly note that this is also an argument against mandatory nutritional labelling requirements on any small volume products.

If there's any steam behind nutritional labelling requirements, there are things we can do to make it less awful.

The easiest labelling requirement would only require that producers give a general range of calories contained per serving of the product based on the alcohol content alone. A gram of alcohol has seven calories, so a standard drink contains 70 calories. Most products could then simply say something like:
"One serving of this product provides 50-100 calories through its alcohol content."
If you really want to know the protein, carbohydrate, sugar and salt content for the drinks, carve out an exemption for small-batch products and for imported products. 

I really love the oddball small-batch beers that turn up in New Zealand, whether made domestically or imported. Anything that adds fixed costs helps to kill that product range. New Zealand has enough problems with fixed costs without inventing more of them.

Thursday, 28 July 2011

Again, what crisis?

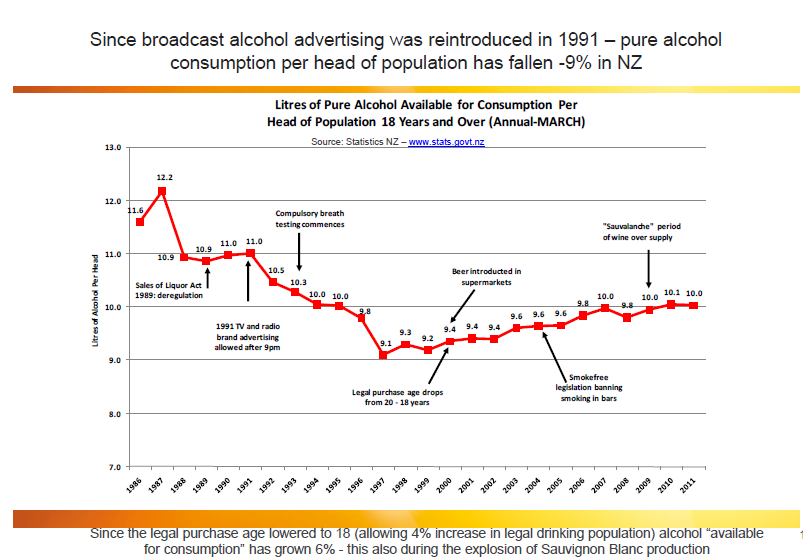
There is no great crisis in aggregate alcohol consumption stats in New Zealand. Via David Farrar:

Per capita consumption is down since alcohol liberalisation in 1989, though slightly up from 1997.

What about problem drinking? Incrementally up among some age groups; incrementally down among others. From the 2010 Ministry of Social Development's Social Report:

Figure H6.1 Potentially hazardous drinking among drinkers, by age, 1996/1997, 2002/2003, 2006/2007

Problem drinking among the 15-24 age group is no different than it was in 1996 prior to the reduction in the legal alcohol purchase age. Things are up a bit for 25-44 year olds and down a bit for 45-54 year olds, though all those differences are really small.

Ah, but what about marginal and worried-over population sub-groups? From the same report:

Table H6.2 Age-standardised potentially hazardous drinking prevalence rate (%), for adult drinkers, by ethnic group and sex, 1996/1997, 2002/2003, 2006/2007
European/OtherMāoriPacific peoplesAsianTotal 15+
1996/1997
Male31.046.148.211.630.9
Female12.030.620.85.113.3
Total21.638.338.19.422.3
2002/2003
Male29.942.444.111.530.6
Female13.324.124.34.814.2
Total21.732.936.18.622.5
2006/2007
Male32.146.846.612.931.2
Female14.528.525.83.814.7
Total23.137.537.78.922.9
Source: Ministry of Health
Notes: (1) Rates are age-standardised using the WHO world population. (2) People who reported more than one ethnic group are counted once in each group reported.

I'm hard pressed to see any there there. If you want to worry tons about the 1.5 percentage point increase in potentially hazardous drinking among Europeans, why not rejoice instead in the similarly trivial percentage point reductions in similar drinking by those from other ethnic groups?

MSD reported we had the 12th lowest level of alcohol consumption in the 30 OECD countries.

Doug Sellman and his ilk ought get honorary doctorates in marketing for their ability to convert the utter absence of evidence of any growing alcohol problem into a moral crisis justifying imposing large costs on moderate drinkers.

In other news, I LOVE how Blogger's new version makes it dead simple for me to paste tables from elsewhere into draft posts.

Friday, 1 April 2011

Jokes that move markets

Farrar at Kiwiblog's excellent April Fool's post:
I understand that a deal has been done over the vacant Labour list spot. Expect an announcement later today that Judith Tizard has accepted the vacant list spot, and will be sworn in on Thursday 7 April.

However in a deal with Labour, she will resign her seat in May, and then Louisa Wall will come in. The other four higher placed list candidates have agreed to also stand aside.

This allows Tizard to make the valedictory speech she was “robbed” of, and also take part in the committee debate on the new Section 92A of the Copyright Act, which she originally authored. She wants to defend the original section, and explain why it was done. After that she will step aside and let Wall in.
The post went live at 7 am; the first comment suggesting April Fool's was at 7:23.

Here's iPredict trading on both Tizard and Wall.


I love the volatility in the Tizard contract. The price ran from 0.50 to 0.82, back down to 0.30, up again to just shy of 0.90, down to 0.32, up to 0.80, then simmered down again to 0.50.

Kudos to Farrar.