Monday, 15 April 2019

Easton on schools

A recent contribution has been from the NZ Initiative’s report Tomorrow’s Schools: Data and Evidence. [EC note: I've updated the link to the Initiative's site rather than Scoop] Unfortunately it is only note of six pages, which does not meet the standards of a research report, so I can hardly comment on the quality or veracity of the findings.

The note observes there are performance differences among schools (it uses NCEA attainment as a measure). No one is surprised that higher-decile schools outperform lower-decile schools by a large margin (on average). However, once the NZ Initiative adjusted for the effect of family background (they dont explain how), they found that the average differences in education outcomes across school deciles disappears. The report concludes that the inequality in education outcomes evident in school league tables is not a result of large differences in school quality, but rather of large differences in family background, particularly differences in parental education.

The NZ Initiative concludes that their ‘research’ demonstrates that the current schooling system is working and should be retained. Maybe; one wants to see the research first, especially as it contradicts the international literature. (I can think of a number of ways one could do the exercise – not all of them would be valid.)

What strikes me is that the NZ Initiative barely observes that the research suggests that the main source of educational inequality (and a whole lot of life opportunities which follow on from it) is ‘family background’, whatever they mean by that. The implications for inequality are hardly explored. As far as I can infer, the NZ Initiative is so besotted with defending the competitive model of schooling it is uninterested in the wider questions of the sources of and policies for children’s opportunities,; issues central to the egalitarian society. That, I think, captures a deep attitude of the elite right; ‘who cares about social inequality providing we are doing all right’.

Indeed there is celebration of inequality when the rich display their wealth. Of course there was inequality in the egalitarian society before 1985, but it was rare for the rich to show it, to display, what Thorstein Veblen called, ‘conspicuous consumption’. After 1985 it became common to flaunt how rich you were.
Our analyst, Joel Hernandez, spent about a year in the IDI lab on this one.

The mission we gave him: start by figuring out how much of the variability in school performance is due to things outside the school's control, like family and student background. Current league-tables could easily mostly be picking up parents' education or income. We need to be able to find the schools that are doing a superb job despite difficult circumstances, so that we can learn from them. The measures out there just aren't up to spec for doing that kind of work.

So he spent the last year merging a ton of administrative data sets and cleaning the data. It is not a small job.* For the population of students who completed NCEA from 2008 through 2017, there's a link through to their parents. From their parents, to their parents' income. And their education. And their benefit histories. And criminal and prison records. And Child, Youth, and Family notifications. And a pile more. Everything we could think of that might mean one school has a tougher job than another, we threw all of that over onto the right hand side of the regressions.

It's student-level observations with a ridiculous number of control variables enabled by the data linkages in the lab.

The point of the exercise wasn't to precisely identify coefficients on each of the independent variables. The point rather was to mop up all of the variation that comes from family circumstances. There's no structural equation modelling here or any attempt at getting at causality among those variables - just a giant reduced-form kitchen sink.

Plus, five hundred or so indicator variables for each of the country's secondary schools.

On the left-hand side - a few measures of performance at NCEA. But that's just the starting point. We're going broader. Employment after graduation. Income after graduation. Progression to tertiary. NEET status (Not in Education, Employment or Training). Benefit uptake. We could even put future criminal activity in there. So far, it's just NCEA though.

After separating out all of the variability that comes from family background, the coefficient on each of the schools' indicator variables tells you the average effect of that school on outcomes.

Our plan had been to put up the big report in July(ish) with all of the method and the first set of results. Then, short reports would follow regularly on different outcomes.

But then the Bali Haque report came out. The report said that there are huge differences in student outcomes across schools, that those differences showed up as differences by decile, that decile differences were inequitable, and that the entire school system needed to be overturned because of it. Currently self-managed schools operating under school boards would be replaced with hubs managing dozens of schools.

There are indeed very real problems in board governance in some failing schools. It's something that features regularly in stories of persistent school failure. But if the justification for abolishing school boards and putting in place a big new governance structure is strong differences in school outcomes by decile, well, we know that that wasn't the case.

So we moved. Because we're a think tank. Forward the short report on the variability in outcomes by decile after separating out the family background effects.

And then Brian thinks we're hiding stuff or trying to downplay the family circumstances, perhaps trying to hide the evidence that big income redistribution schemes are warranted.

It would have been irresponsible of us to put up the coefficients on the other correlates. We have a kitchen sink of variables to mop up effects, not to precisely identify the coefficients on any of them. Putting up all of those coefficients without checking their sensitivity would have been premature. We control for whether the child is from a single-parent household. Whatever the sign on the coefficient, it would feed into culture wars around divorce and the desirability of two-parent families. We control separately for mothers' and fathers' incomes, and mothers' and fathers' educations. Results could feed into arguments around two-earning families. Most of those control variables would fuel one interest group or another. And even if we were sure we had the numbers right, they're still not causal. If you find that kids of well educated parents perform better at NCEA, that doesn't mean you should start giving degrees to parents to boost their kids' chances.

We'll have more in the full report. What we have so far though lends zero support to arguments around redistribution. Parents' education matters a ton. Income - not so much when education is controlled for. But we need to play with it more before we say anything more. If we have to suffer Easton's grouchiness for it, oh well.

But our object here is the exact opposite of Easton's imaginings. If we can identify the schools that do a fantastic job with kids that other schools have a hard time helping, that means the Ministry or ERO could go into those schools and see whether they're doing anything differently from schools that aren't doing such a good job. Sure, it would take a policy change around operational use of IDI. But it is entirely doable. Learning from that can help lift performance for those that too many schools are currently failing.

And there are all kinds of ways of handling it.

Within the current model, you could get reports from the Ministry to every school board telling them where they're doing well, where they're doing poorly, and which schools they might want to learn from (and which might need their help). The reports would help empower school boards that cannot tell whether poor outcomes are because the community is disadvantaged, or because the Principal is failing. And if the data were available to the parents, that could encourage parents to take a more active role in board governance in places where there is underperformance. Both voice within the school, and exist from underperforming schools, could help encourage better performance. And don't pretend that this is bad because the status quo is some paradise where all the schools are doing great and everyone sends their kid to the local school. Right now, parents use worse proxies for school performance and will happily walk by an excellent low decile school to get their kid into a higher decile school that's further away. The local school might be the one who could do more to help their kid. But we can't tell without better data.

Within a hub-based model, the reports provided by the Ministry could help the overarching structure to manage performance among their schools, to send investigators in to figure out why one school is doing particularly well in ways that nobody had noticed before, and to use what they learn to help others. They could use it to test the effects of different kinds of practice on outcomes. In the data lab, what goes on in the schools is a black box. We just don't know. But the hubs might know that one school never shifted to modern learning environments and the other one shifted to them 6 years ago. It could look at whether those kinds of policies had any effect.

Either way, it would also help the Ministry in similar ways. It could help ERO check whether any of their interventions improve student outcomes.

There is just so much that can yet be done with better use of the data we have. I've been pointing to it for years. Nothing's being done about it. The Ministry has a staff of 3000; we have Joel. We don't have time to do all of it. That's one reason we're opening up all our code in the lab for others to build on.

Imagine if every guidance counsellor in every school received a report from the Ministry for every student. The report for each student finishing Year 10 would say "Here are a thousand kids who looked a lot like you 5 years ago, and another thousand who looked a lot like you 10 years ago. Here are the choices they made about paths through school, through to tertiary or vocational training, and their later employment outcomes. Here's what the kids like you who chose a Bachelor's Degree are doing now. Here's what's happened for those who chose vocational training. Many of these choices may never have occurred to you." It is entirely feasible to do this right now. It would take a few months' coding. After that, it's just push-the-button. And it isn't being done. 

What difference could it make for a kid who never considered university a possibility, because of the community she grew up in, to see that other kids with similar academic records had done brilliantly at uni and that they'd better push to do the UE courses? What difference could it make for a kid whose parents were pushing university to see that kids with comparable records did far better pursuing a trade? Better information has to help.

We have a pretty big work programme here on deck. Once Joel's code is up in the data lab, I'll put up a note about it. I've already been in touch with friends back at Canty. One substantial barrier to assigning IDI projects for Masters thesis work is that you spend a year in data cleaning and matching (and just learning your way around) for any big project. You can't dump that on a Masters student without strong risk that the project falls over. But you can assign projects that build on an existing codebase.

Academics won't put up their code because their incentive is the opposite of ours. They'll want to get the vita lines on every possible way of dicing the data after fronting the fixed cost of merging it. Just look at access around the Dunedin Longitudinal survey, or some of the others out there. Tons of publicly funded work locked up for the benefit of those who ran the surveys.

We want ours to be as open as possible within the constraints set by StatsNZ around the data lab. We want way more people using that code base to see what's going on in education. And if any of them find ways of improving the code to improve match rates, even better!

Our work here is a starting point.

* Even worse, it seems to be a much-repeated job, with anyone doing work in the area duplicating efforts. Joel will be getting all of his code up into the StatsNZ wiki for others to build on - the process for getting it in there isn't trivial though.

Thursday, 11 April 2019

Continued census whoas

Stats has started providing some detail on the missing response figures in the last Census.

Motu has followed Brian Easton's earlier call to bring forward the next Census to 2021, returning us to the timings we were on prior to the Christchurch earthquakes.

A correspondent raises a few further questions, which I hope are answered in the full report on the 2018 Census:

  • There are substantial differences between responses with a missing question or two, and responses where the respondent has only filled in their name. How big of a mess are we looking at?
  • The web-based Census may have had some problems, but it may also have provided some opportunities. Like, how many responses suggest the respondent isn't really taking things seriously - for example, by ticking the first box on every question. This could have been done in real-time, prompting a follow-up visit. Did Stats do any of this?
  • My correspondent finds it odd that there are more people who didn't do the Census at all than that left at least one question unanswered. I'm not so sure there - if you're filling in the web form, it can prompt that you've missed a question before it lets you move on to the last page. I'm not sure if the survey did that or not though. 
A have a few others:
  • If they're interpolating data from other administrative sources, are they filling blank cells from relevant admin data, or putting in an average based on matched other respondents' answers? How are these generated answers flagged in the data? This will matter for researchers doing things like checking the correspondence between census responses and administrative data to see how well the two line up. But it'll also matter for any research using those generated answers. I expect Stats will be well on top of this. 
  • We keep hearing Labour partisans blaming National for not sufficiently funding Census. Did the Government Statistician raise any specific risks in the shift to the online Census under that funding arrangement? If the Government Statistician had raised a lot of concerns about the viability of the Census under the funding provided, and National went ahead anyway, then pretty fair to sheet it back to National. I do not know what warnings of risks were provided.
  • I had thought that the funding allocation for the 2018 Census built in some of the expected costs of shifting to an online census model, with the prospect then of lower cost censuses to come. Given the problems in 2018, will that have to be revisited? 
  • We hear rumours around that non-responses were concentrated among particular communities. Stats' statement doesn't get into that yet, as they weren't asked. We should expect to see more detail on that in the full reporting yet to come.

Wednesday, 10 April 2019

A bleg for knowledge about knowledge

If I want to know what people know about politics and their political systems, I know where to go. Jack Vowles's New Zealand Electoral Survey has some basic civics knowledge in it; for the US, I'd look to Dye & Ziegler or Scott Althaus.

But I'm now looking for work on general knowledge. If there's any decent work out there, and especially if it gives international comparisons, on basic public knowledge of basic facts, I'd love to hear about it. Like basic facts about geography, science, world history, that kind of thing.

Any pointers appreciated.

Tuesday, 9 April 2019

A compassionate Treasury

Your regular reminder that Treasury today is rather different from the Treasury of the 80s and 90s.

I'm going to copy and paste rather more of this than I usually would, just in case the thing gets deleted.

There's a $35 registration fee for this event at Treasury.

I have no clue whether the money goes to the folks running the session or what; I suspect it covers a cost of the deck of cards provided. But they recommend that attendees buy a deck of their cards in advance as practice as well, so attendees would wind up with double the compassion. It's wonderful how Treasury is helping to promote a small business by hosting it and encouraging folks to buy its products.

Minister Jones would approve, if Heartwork were based in the Provinces.

Here's the pitch. Treasury is Love.

Imagine surprising Aotearoa with a strain of compassion so delightful that it re-wires our collective consciousness!

COME TO THIS SOCIAL LAB TO CONNECT AND CREATE TOGETHER.


Heartwork

+ Fiona Ross - The Treasury Chief Operating Officer

+ David Dougherty - The Treasury Manager Strategy and Performance

+ 24 curious and creative people at The Treasury

have been experimenting in the social lab.

We’ve created a "compassion starter culture" - a network of people who want to create a more compassionate culture in Aotearoa, starting where we are - in our workplaces.
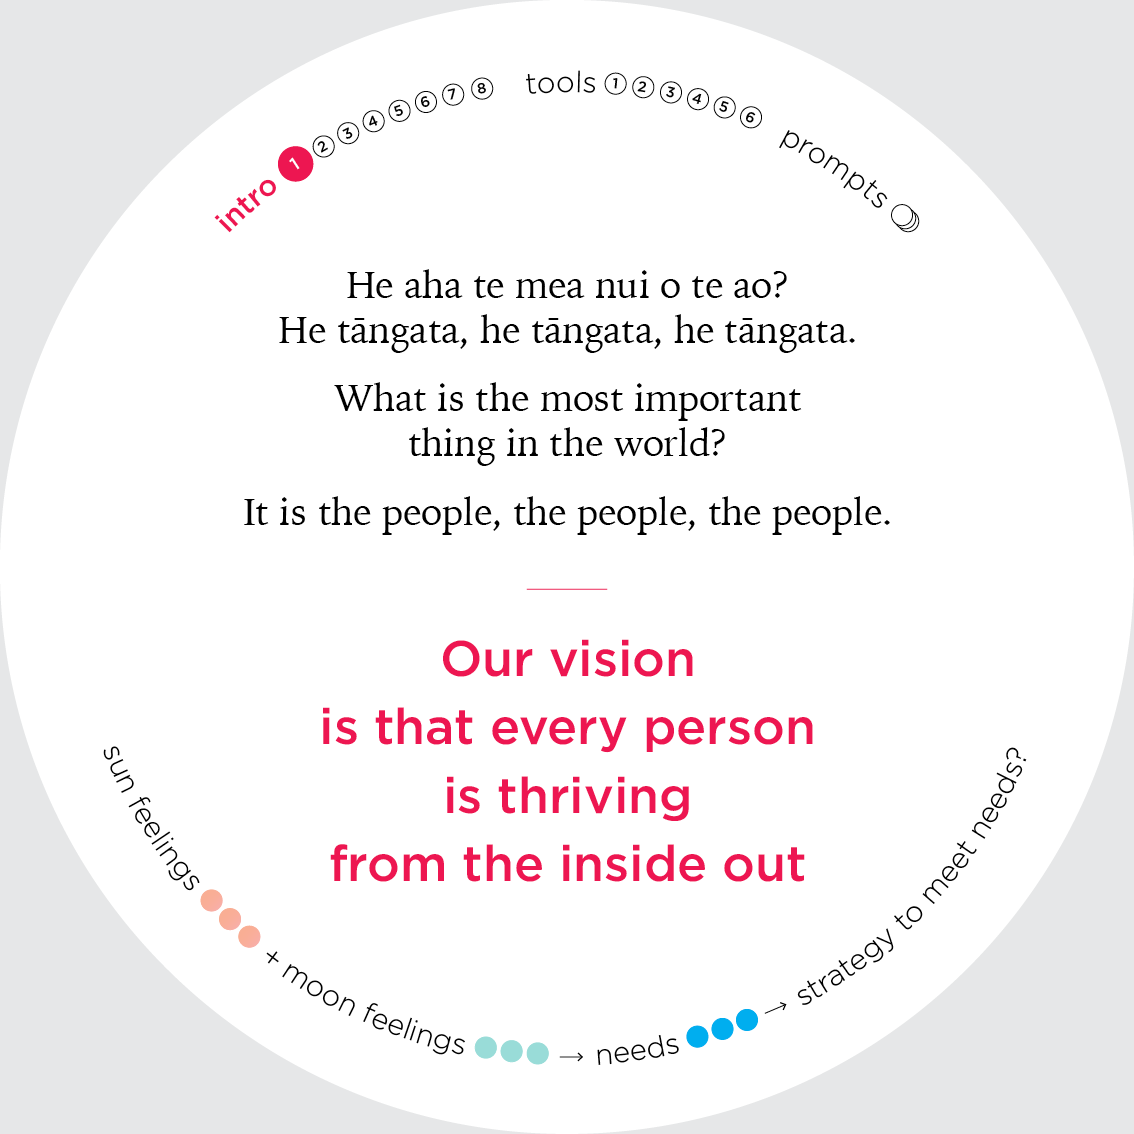
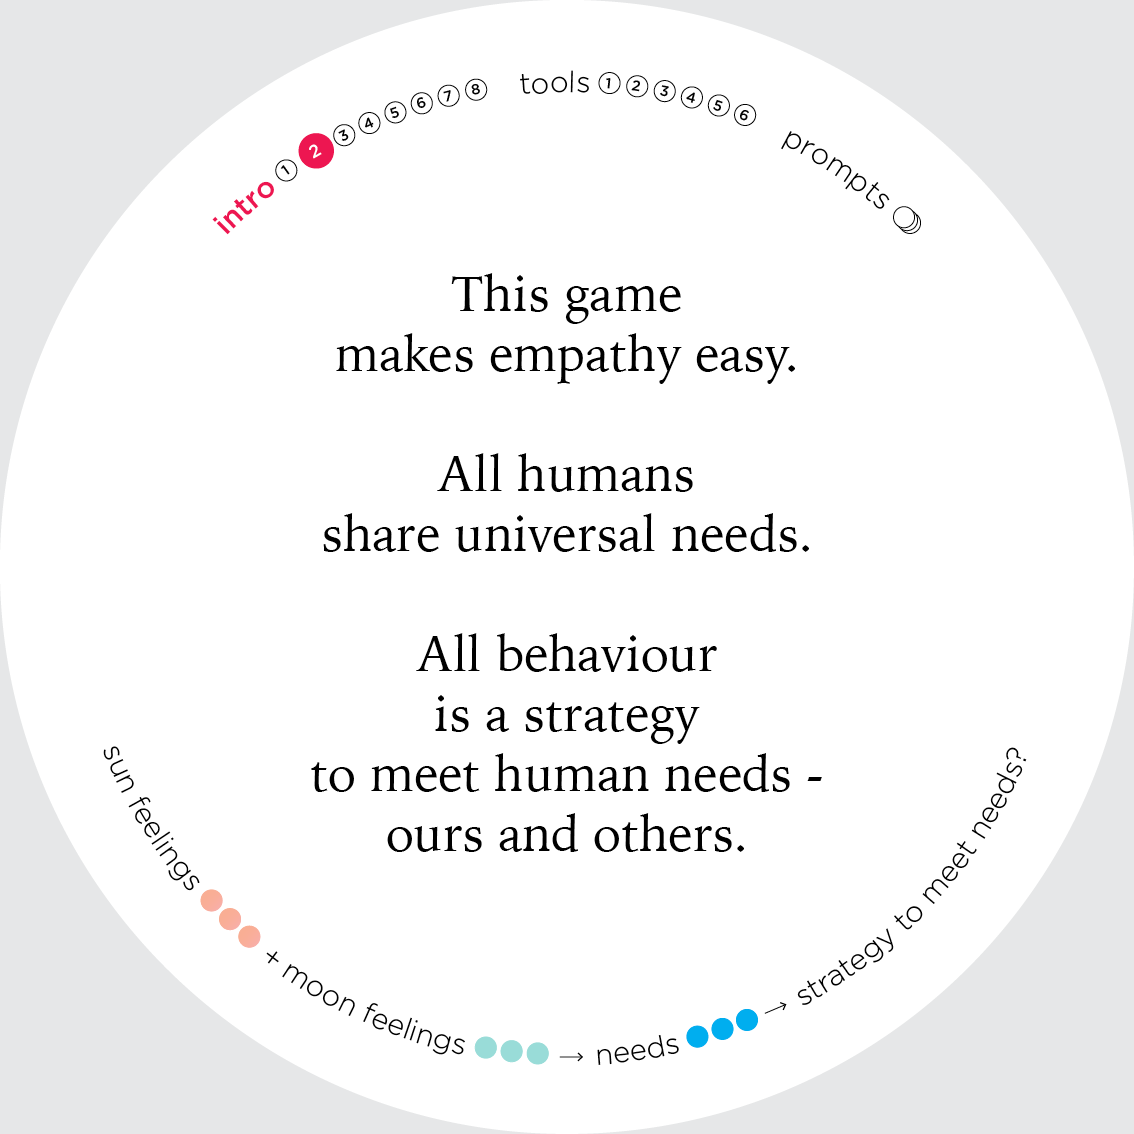
We’ve been playing and rapidly prototyping with the Heartwork Wellbeing Card Game* - now available publicly.
We know that the intention for what we want to create has a huge power.
We don’t have all the answers. And we can't do this mahi alone.

So we’d like to invite you into this social lab.

So we can grow an even more beautiful, and more resilient strain together.
We'll share what we’re learning while we’re still metabolising.
Heartwork and The Treasury
Come along to:
  • Hear from Fiona Ross about what she’s been learning from her experiments with the Heartwork cards in her work as Chief Operating Officer of the Treasury.
  • Meet the Heartwork team and understand the potential they see for people to be 1) meeting their own needs 2) meeting each others' needs and 3) creating more delightful outcomes together with Aotearoa.
  • Learn at least three powerful ways you can use the Heartwork cards to cultivate a 'win-win-win' culture for Aotearoa, your teams and yourself.
  • Play the card game and share stories with other people who care deeply about people.
  • Connect with other people who want to cultivate compassion throughout Aotearoa.
  • Contribute ideas and co-create with us as we consider how to take this kaupapa forward together.
Heartwork's Wellbeing Game

Simon Sinek quote

Watch our video about the card game here.

"The cards are a really good way to recognise what you need to do to end up with positive outcomes. After using them I felt more complete, certain of what [the other person's] feelings and needs were, and was able to come up with different strategies to find solutions for negative feelings I was having." - Penny
Heartwork and The Treasury
"Before having [a] chat I used the cards to check in on what I wanted to feel and not feel, and what I wanted them to feel and not feel. This really helped me identify my needs and what I wanted out of the conversations- which then helped me put together a really quick plan. And it took 5 mins tops. So I went in more prepared emotionally as well as intellectually; and being more intentional is a work-on for me.
As a result I feel the conversation went well and I am more confident in my decision and the reasons for it..." - Sam
what could we create together with the power of win-win-win intentions
*win-win-win: good for you, good for others in your organisation, and good for society as a whole.

FAQS: (contact us if you have other questions that aren't answered here)

It sounds like this event is targeted to people who work in government. Can I attend if I don't work in the public service?

Yep - if this invitation speaks to you, you're more than welcome to attend.

Can I take home my Heartwork cards on the night?

Yep. We recommend ordering your cards through our website now, and we'll give you a pack to take home on the night.

I can't make it until 5.30pm. Can I arrive late?

No can do sorry. The Treasury security system means that you will need to arrive promptly at 4.45pm to be able to get into the building.
Heartwork's Wellbeing Game


I, for one, love that this is a priority both for Operations and for Strategy and Performance at Treasury, as indicated by the attendance and presumed endorsement of the Chief Operating Officer and the Manager for Strategy and Performance.

Just imagine how better Treasury would have been prepared for the currency crisis after Muldoon lost election if they had thought to consult both their sun feelings and their moon feelings. I don't know how New Zealand came through it without that. But we will be far better prepared for the next crisis. Treasury may have few remaining economists, but every single person who remains there will care deeply.

And surely that matters more than anything else.

Update: Here's Newshub's take on it, with reporting by Tova O'Brien. The Prime Minister doesn't know what moon feelings are; Treasury refused to answer questions about it.

Friday, 5 April 2019

Census Whoas

If Stats NZ does not produce detail for Parliament on non-response rates in the last Census, its Chief Exec may be up on Contempt of Parliament. 

Here's Stuff:
Government Statistician Liz MacPherson is facing contempt of Parliament after being ordered by MPs to produce census information.

In an unusual move, a select committee has placed a standing order on Statistics NZ chief executive to produce the number of partial responses were received in Census 2018.

MacPherson was first asked by to provide the answer by the governance and administration select committee during its annual review in February, and again on Wednesday. Both times she declined.

The chief statistician now says she will provide the information – which could further reveal the extent of Census 2018 issues – not on the given April 10 deadline but as part of an announcement promised later in the month.
National's been a bit displeased with Stats, or at least so goes the rumour 'bout town, since GDP revisions and immigration figure revisions that, had they been correct the first time round, might have affected the last election. But this is a unanimous request of the committee for information - it isn't just Nick Smith.
MacPherson was unavailable for an interview on Friday, but in a statement remained firm that it was not the appropriate time to release the number of partial responses to Census 2018.

"It is my hope that the committee will appreciate that I have made this determination after careful thought and application of statistical best practice.

"Without the appropriate context, these individual numbers would be open to misinterpretation," MacPherson said.

She said the number of full and partial responses would now be provided in an announcement later this month, when Stats NZ would also detail when the first census results would be released.

"This is simply a question of timing ... When we produce information for the public we outline the methodology and limitations of any data produced," MacPherson said.
Fair enough, but it has been more than a year since the 2018 Census.
University of Otago professor Andrew Geddis said it was "very unusual" for such an order to be placed on state sector chief executive.

"I can't remember a time a public servant has refused after being told they must answer."

If a complaint was taken to the speaker or the House, Macpherson could be forced to apologise or be censured by the privileges committee.

"That would be a very major escalation. I would expect that the House treat it as contempt."
Meanwhile, other parts of Stats are still trying to figure out how to measure spirituality

Thursday, 4 April 2019

Migrant acceptance

Arthur Grimes' latest column at Newsroom covers migration and wellbeing. 
The happiest countries in the world tend to be quite affluent but also tend to have strong social support programmes. In 2018, the ten happiest countries according to the Gallup Poll were (in order): Finland, Norway, Denmark, Iceland, Switzerland, Netherlands, Canada, New Zealand, Sweden and Australia. Thus New Zealand, at 8th, is (despite our grumbles) a great place to live.

Often migrants come from poorer, and less happy countries. The process of moving to happy countries (e.g. in Northern Europe, Canada and Australasia) leads to a significant boost in their welfare.

Indeed the top ten ranking countries for average happiness of migrants (i.e. of the foreign born) is almost the same as for overall happiness: Finland, Denmark, Norway, Iceland, New Zealand, Australia, Canada, Sweden, Switzerland, Mexico (Netherlands slips fractionally to 11th). Note that New Zealand rises to 5th in the ranking of happiness of migrants.

An important factor for explaining migrant wellbeing in their new country is the local attitudes of the domestic population towards migrants. The report finds that countries which are highly accepting towards migrants tend to have both greater migrant happiness and greater happiness for the domestically-born population.

This aspect is one in which New Zealand scores particularly highly. According to the Gallup Poll data, Iceland and New Zealand are neck-in-neck at the top of the most accepting countries for migrants. Intriguingly, acceptance of migrants is not strongly related to country incomes: the next five places after New Zealand in the acceptance stakes are Rwanda, Canada, Sierra Leone, Mali and Australia. (People in Eastern European countries are particularly unaccepting of migrants. Of the eleven countries who are, on average, least accepting towards migrants, ten are in Eastern Europe; the other is Israel).
He links through to the underlying data, from the 2018 World Happiness report. That report constructed a migrant acceptance index:
In reaction to the migrant crisis that swept Europe in 2015 and the backlash against migrants that accompanied it, Gallup developed a Migrant Acceptance Index (MAI) designed to gauge people’s personal acceptance of migrants not just in Europe, but throughout the rest of the world.

Gallup’s Migrant Acceptance Index is based on three questions that ask respondents about migrants in increasing level of proximity to them. Respondents are asked whether the following situations are “good things” or “bad things”: immigrants living in their country, an immigrant becoming their neighbor and immigrants marrying into their families.

“A good thing” response is worth three points in the index calculation, a volunteered response of “it depends” or “don’t know” is worth one point, and “a bad thing” is worth zero points. We considered volunteered responses such as “it depends” because in some countries, who these migrants are may factor more heavily into whether they are accepted. The index is a sum of the points across the three questions, with a maximum possible score of 9.0 (all three are good things) and a minimum possible score of zero (all three are bad things). The higher the score, the more accepting the population is of migrants. 
Polled Kiwis gave the second highest average score in the world: 8.25, just 0.01 points below Iceland's 8.26. The survey questions were asked in 2016 and 2017.

Michael Reddell's post earlier this week on immigration suggested that policy allowing reasonably liberal immigration represents an 'elite' ideology.

It may.

But if it does, it's an elite ideology that appears very broadly shared - at least in the Gallup data.

Wednesday, 3 April 2019

Hard to short housing

Mike Reddell points to Phil Twyford's speech on housing and wonders why, if folks with money on the line take him seriously, house prices haven't started dropping yet: The housing supply agenda looks good, but if it were credible, house prices would already be dropping.

It's a good question. My answer to it: it's darned hard to short housing.

Think about other markets covered by the NZX or futures markets. People there are betting all the time on whether prices will go up or down. If you think prices will rise relative to current price expectations, buy now or buy futures. If you think they'll drop, sell futures or buy options to sell in the future. There are lots of ways for people to trade in future prices, regardless of which way they think things will go.

Suppose you wanted to bet on Twyford's being right and you only own your own home. You might sell your house, rent another house, and hope to buy a house at a much reduced price in a few years time. But you'd have to live in a rental for a few years, and current broken housing markets have meant that the rental market sucks. It's an expensive option. If you think the price of soy beans will drop in a couple years, you can make a few clicks and have some options in your portfolio. You don't have to go without food for a couple years.

And everyone who thinks Twyford is wrong - well, it's easy to put a bet on house prices increasing. Maintain your current property portfolio or expand it.

There is a related literature. During the GFC, there were bans on short-selling. Those bans reduce the efficiency of prices and lead to bubbles that can persist and make crashes more likely.

There's no ban on short-selling housing here. But neither is there any obvious ability to do it. There are no Case-Schiller indices here. Other mechanisms are more complicated. Short companies or funds with lots of exposure to property? Even if house prices drop, the value of a set of properties could rise if more intensive land use is allowed. If there were some company that owned a pile of landbanks on the fringes of Auckland, and it were publicly traded, you could try shorting that one.

Just because I can't see any obvious way of shorting housing doesn't mean there isn't one. But the asymmetry in ease of going long versus short can make prices more persistent.

I put reasonable odds on Twyford's actually being able to get this done. Here's a likely sequence of events in that case.

After new infrastructure financing vehicles come on-stream, new leapfrog developments are announced. The first few advertise all-up prices (including the levy that funds the bond that funded the infrastructure) not far below current prices, but far enough to attract interest.

Existing landbankers see what's happening, recognise Twyford's serious, and rush to get their properties developed and sold before prices fall the rest of the way down to paddock price plus infrastructure cost plus construction cost.

Capacity constraints in construction will be even more binding. That will slow down the price drop unless government is able to progress other parts of the supply agenda that are less advanced, or not even yet on the table. Building material supply regulation. Ability to access foreign construction workers. Ability for foreign developers able to build at scale to work in the New Zealand market given the constraints of the OIA, the foreign buyer ban, building material supply regulation, and ability to bring in their own workers.

And Council risk-aversion in consenting driven by joint-and-several liability remains an issue - though if the government's Urban Development Authorities can not only provide resource consents but also sign off on final building certificates, that might help.

So without complementary policy easing other constraints, the path to new equilibrium prices will not be a fast one.

If you want a handle on why prices haven't dropped yet, it'll be the combination of those other capacity constraints pushing out the date for getting much lower fringe prices and the inability to short.

If Case-Shiller markets in Auckland housing existed, I'd be looking about 4-5 years out - but I'd also want to be talking with some construction folks before doing anything.