Showing posts with label inequality. Show all posts

Friday, 2 July 2021

Credit Suisse wealth inequality data

Bob Gregory's latest rant against the evils of neoliberals inspired me to pull together the latest Credit Suisse wealth figures. The social democracies in Europe usually turn up as a lot more unequal in wealth than NZ, and I was curious where the latest numbers might put things. 

The latest iteration has NZ with the 145th most unequal wealth distribution of the 168 countries in the data set, or the 24th most equal. I've highlighted NZ in red and Sweden, Germany, Finland and Denmark in Green (from left to right). NZ is way over on the right, just to the right of France which you can't really see. 


NZ has more traditionally been toward the middle of the pack. The 2017 data had us 80th most unequal of 171, and a bit more unequal than France. This time we're a bit less unequal than France. 

Recall that Gini measures the area between the Lorenz Curve and the line of perfect equality. So a Gini of 0 means we're on the line of perfect equality. It's a measure of all against all; other inequality measures measure different things. 

In this case, I'd bet that sharp housing price increases are driving increases in wealth portfolios for middle-wealth households for whom house is the primary asset, and that the equalising effect of that is currently dominating the effect on households who don't own any house. 

So it'll come down again in due course if housing gets corrected, and presumably at that point the inequality-shouters will shout about the rise in measured inequality back to where it was a few years ago. 

Note that this is a PDF to Excel conversion by SmallPDF which looks to have done just a superb job of things - but there could be OCR errors that I hadn't caught. 

It probably highlights one of the problems in just using Gini. The more important growing inequality is between insiders and outsiders in housing markets, but Gini has wealth as having become more equal. 

I have come to expect Oxfam NZ reports shouting about the latest Credit Suisse figures, taking whatever they can from them to provide reason to worry about inequality and give them money. This year's Credit Suisse report was delayed. I wonder whether Oxfam will have noticed that NZ's wealth distribution became far more equal. 

Monday, 28 June 2021

Afternoon roundup

A very long overdue closing of the browser tabs brings these worthies:

Friday, 25 October 2019

Setting the marker for January - the wealth report

Every October, Credit Suisse puts out its report on global wealth. It's not perfect, but it's a decent best guess about global wealth and its distribution.

And every January, Oxfam comes out with a The Sky Is Falling And Inequality Is Terrible gloss on the Credit Suisse figures. If you were teaching a How To Lie With Statistics course, the Oxfam reports would provide excellent fodder.

So, a few highlights from the Credit Suisse report, so we don't forget them come January when the Oxfam report comes out.

The report is here.

First up, New Zealand's place in the global wealth inequality figures.


(And here's a static version in case the interactive doesn't work)


There are 172 countries with a Gini coefficient on wealth. New Zealand's Gini (in red) is the 37th lowest.

Among the countries with more wealth inequality than New Zealand, in order starting with countries closest to us: Portugal, Iceland, Spain, France, Switzerland, Canada, Austria, Finland, Ireland, Norway, Denmark, the US, Sweden and the Netherlands.

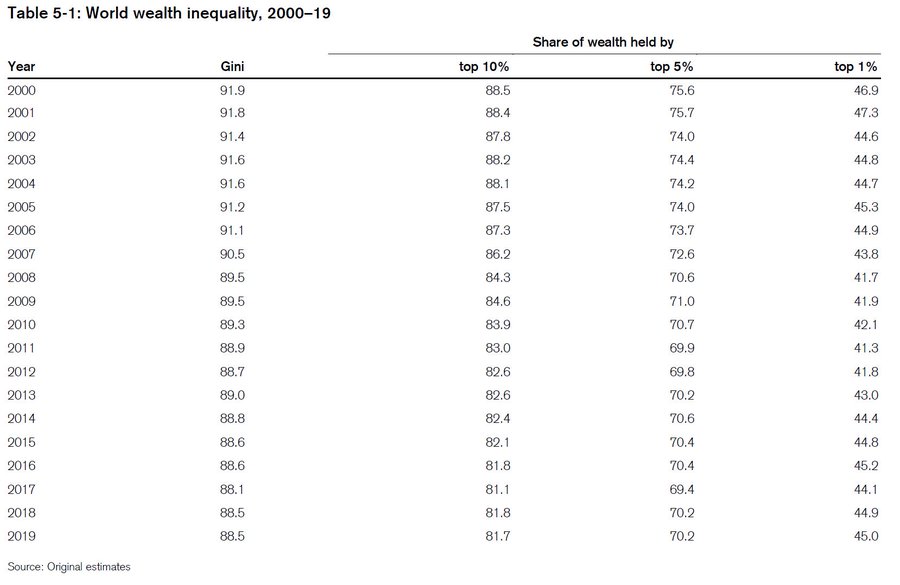
Global wealth inequality has been dropping, more or less, since 2000.


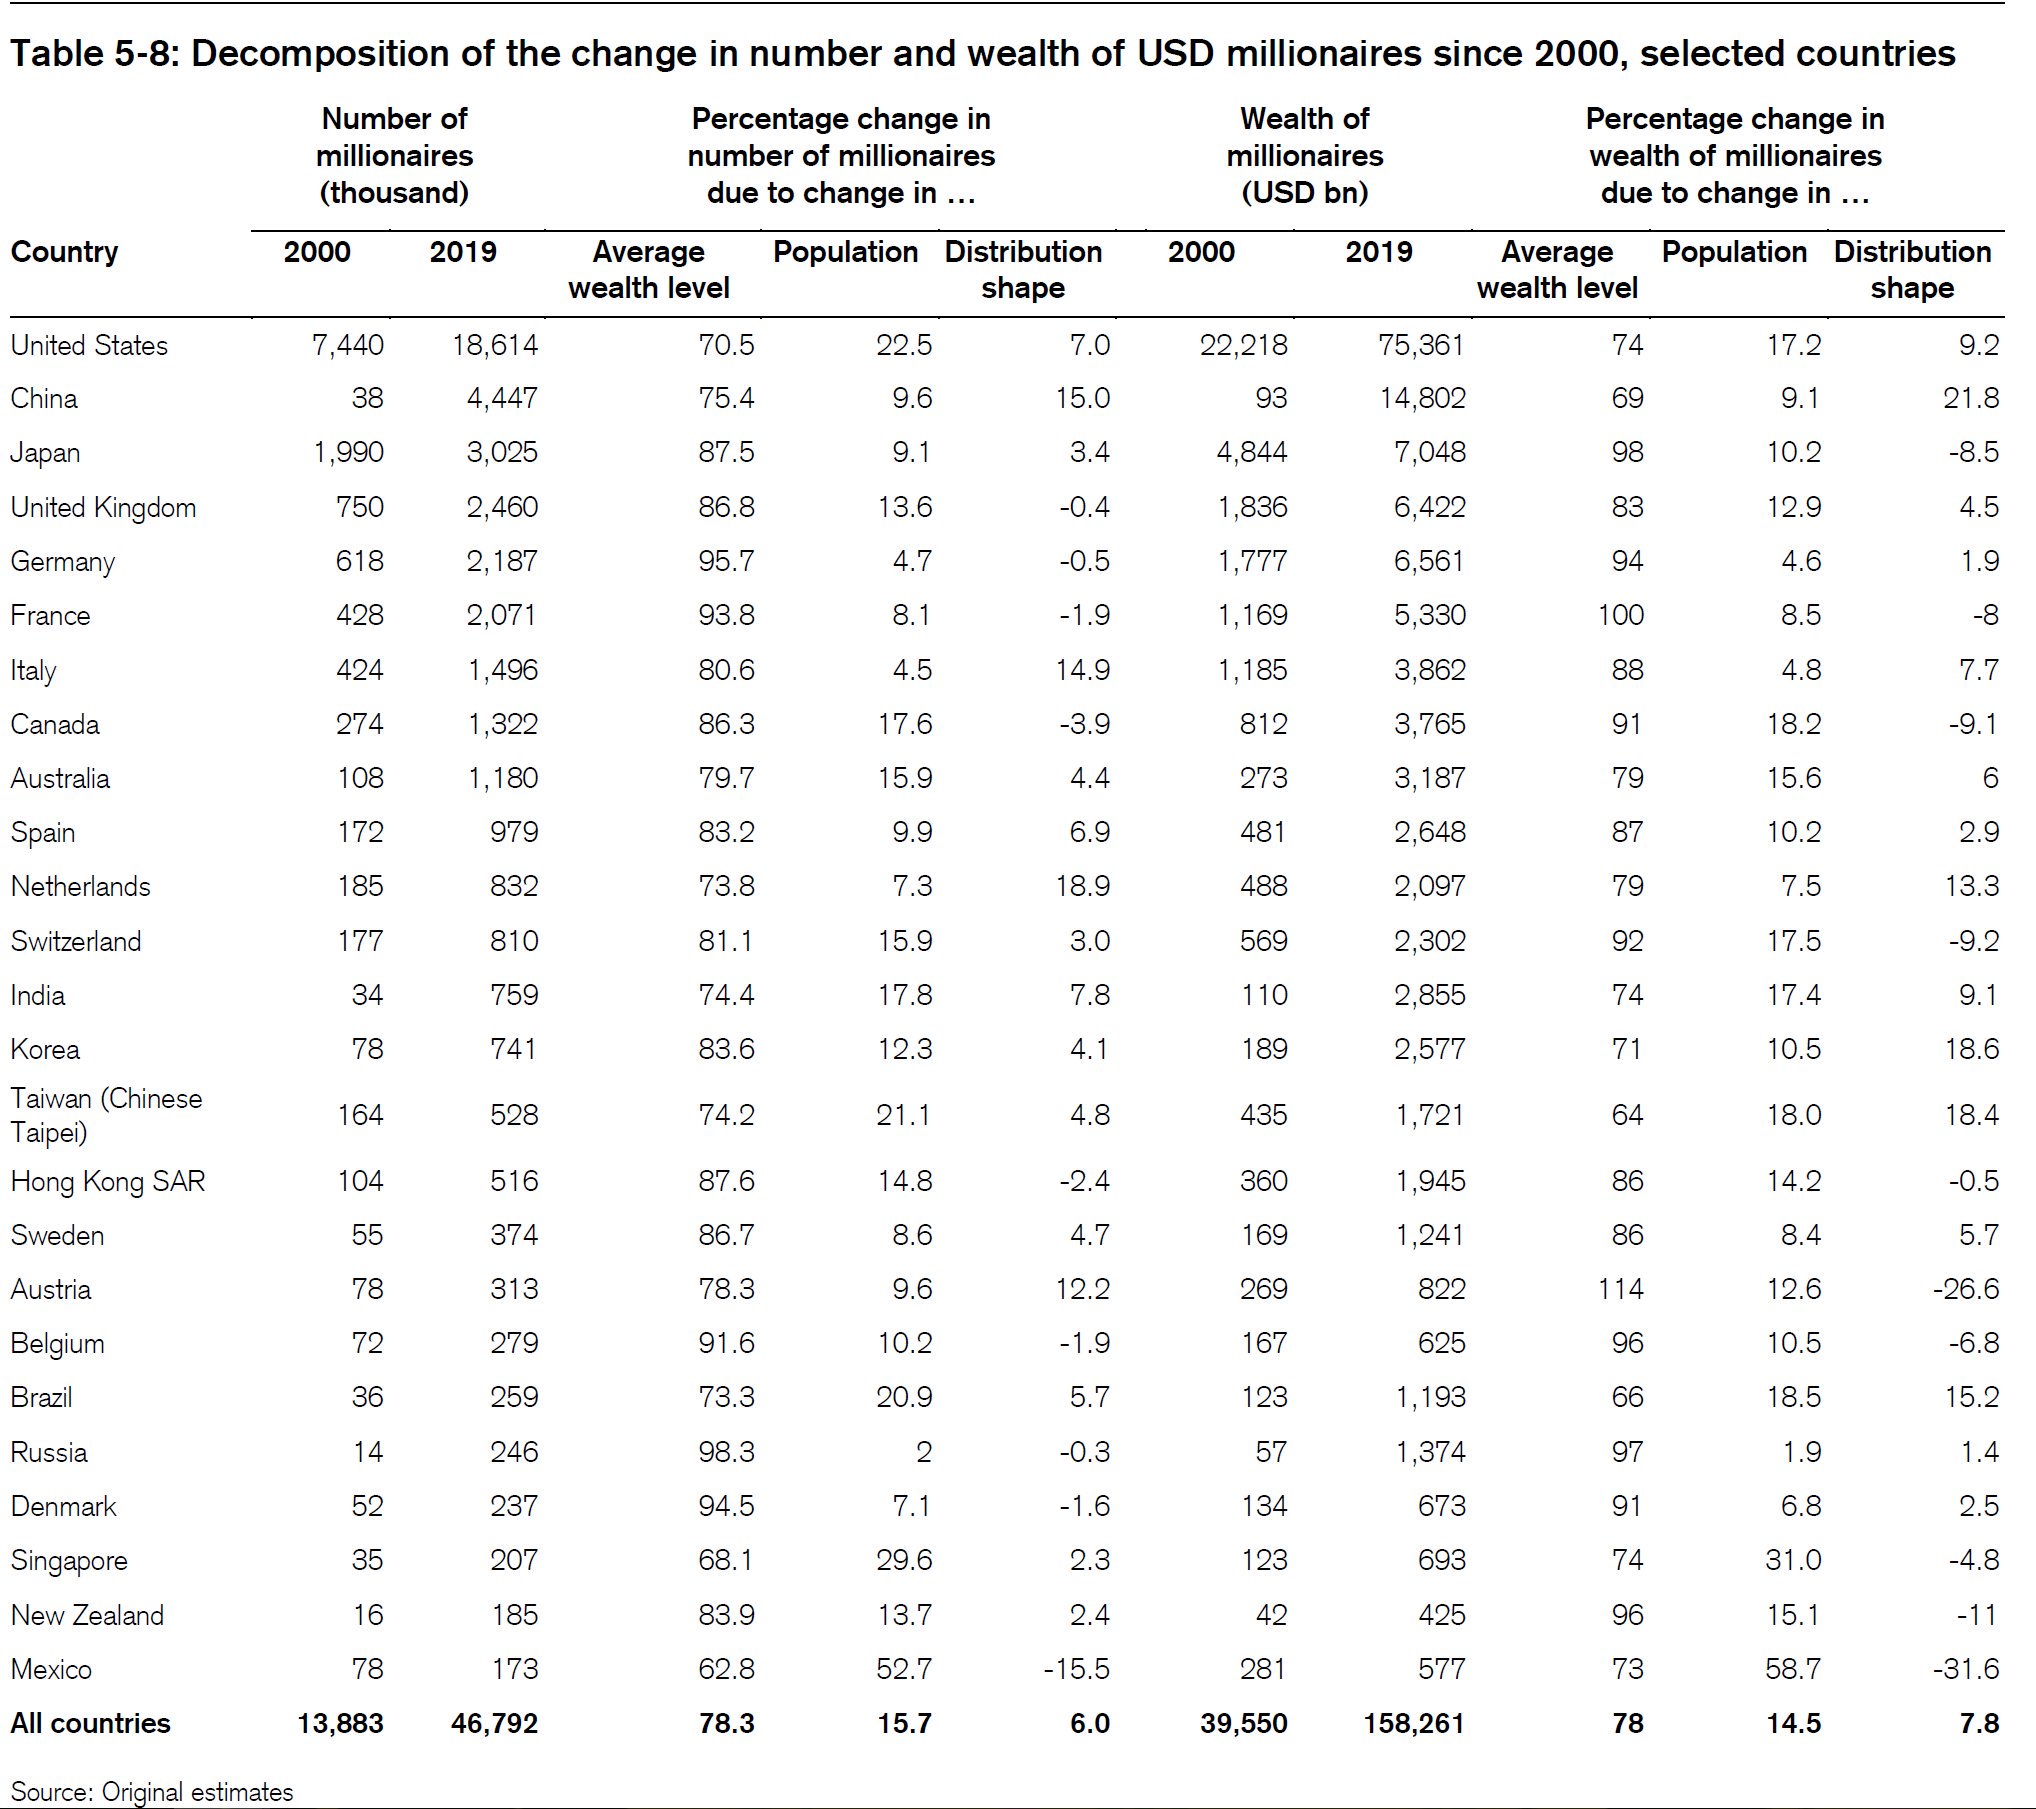
And they also decompose changes in the number and wealth of millionaires. You can get more and wealthier millionaires if all incomes rise, if population increases, or if the shape of the underlying distribution changes to favour millionaires. Here we see that since 2000, changes in the shape of the distribution have resulted in our millionaires having less wealth than otherwise. 


And this year's Gini is down on last year's as well. 

If I were Oxfam and wanted to put up a scare story about inequality out of this, but one grounded in the numbers rather than just being fantasy, I'd look hard at how much of the measured reduction in inequality is driven by changes in housing wealth. Recall that housing is a substantial part of the wealth portfolio of those in the middle wealth deciles, and that increased houses prices do more to boost wealth in the middle than at the top. But there can be strong disparities between homeowners and non-owners. That's a story of anticompetitive housing regulation set by councils under incentives set by central government rather than one about evil rich people and the need for income redistribution. 

Friday, 2 August 2019

Afternoon roundup, and around the traps

The worthies on the closing of the browser tabs.

Wednesday, 30 January 2019

Wealth inequality

I go through some of the complications in trying to weigh up wealth and inequality in this week's column over at Newsroom ($).

A few fun (and perhaps surprising) facts:
  • Government provision of some services can increase measured wealth inequality even if they result in no change whatsoever to anyone's lived experience. Converting each Kiwi's NZ Super entitlement into a private account would reduce measured wealth inequality by giving everyone a lump-sum. Converting each Kiwi's health system entitlement into a lump sum transfer into a medical savings account (with government top-up for big events) would have similar effect. 
  • Stats NZ's data shows median wealth increased from 2015 to 2018.
  • Credit Suisse data has half of all adults in the global top 10% for wealth - and showed a drop in NZ's wealth Gini coefficient from 2015 to 2018. 
  • On the Credit Suisse Gini, NZ sits midway between France and Canada; on the OECD's measure of the share of wealth held by the top 10%, we're below Denmark, the Netherlands and the US, roughly on par with Canada, France, the UK, Ireland and Austria, and more concentrated than Japan and Italy. We're also more concentrated than Australia - but remember that Oz has greater reliance on private retirement accounts.

Monday, 21 January 2019

Oxfam - again

Every year, Credit Suisse puts out its October report on global wealth.

Every January, Oxfam releases a gloss on that report. Every time, the policy recommendation is the same - tax wealth.

The Dom Post's Tom Hunt went for Oxfam's bait this time round. It was a bit frustrating because Oxfam didn't have its report up on its website until this afternoon; Hunt's story was on the Dom's front page first thing in the morning. Hunt's headline: Rich richer, poor poorer (at least on the print edition).

The only mention of New Zealand in the Oxfam report is in a note that Oxfam NZ is a local partner in the report. But their data comes from two sources. They use Forbes' rich list (why not NBR's if they actually want anything local?), and Credit Suisse's October report.

What do we find in the October Credit Suisse report? Currency movements. Total NZ wealth dropped from $1,037 billion USD last year to $1,010 billion USD this year - in current exchange rate terms. At constant exchange rates, wealth instead increased from $995 billion to $1,053 billion.

Recall that middle-wealth households have disproportionate amounts of wealth tied up in their houses. If the exchange rate moves, their reported wealth in USD terms will drop. Recall that richer households have more substantial financial assets (relative to their housing assets) and will be diversified. They're hit less by exchange rate changes. So when the exchange rate drops, it looks like richer households are hit less than poorer households. The report notes a -7.2% change in the value of the NZ dollar against the US dollar.

What else can we quickly see in the Credit Suisse report? The Gini coefficient for New Zealand, this year, is 70.8. Last year it was 72.3. That's the opposite of Hunt's headline. I think that headline came from Forbes' figures on the two richest people in New Zealand rather than from the more comprehensive Gini stat. A headline coming out of the Credit Suisse report could easily have been "Wealth Inequality Drops". But that isn't the story Oxfam wants to tell, and nobody at the Dom seems to have checked the source data.

I can't be bothered turning Credit Suisse's PDF into a Google Sheet this go-round; the drop is equivalent (against last year's data) to moving six places in last year's ordinal rankings.

What else is in there?

Since 2000, the start year of their data, median wealth per adult increased from $26,933 to $101,718 last year to $98,613 this year; mean wealth per adult went from $71,632 to $300,988 last year to $289,798 this year. So the median is 3.7 times higher than it was in 2000 and the mean is 2.9 times higher than it was at the start of the period. Both mean and median wealth dropped from last year. So another headline could have been "New Zealand is poorer (but it's mostly currency movements)."  Note that these numbers vary substantially from last year's go round - the base figures are different than they then were. I assume that they've updated exchange rates but I don't really know.

New Zealand now has 1,725,000 adults with more than $100,000 USD in wealth, and 155,000 with more than $1,000,000 USD in wealth. Again, owning a house in Auckland mortgage-free gets you pretty close to that million dollar mark. But twenty thousand fewer Kiwis make the cut for the global top 1% - we're on the list of the world's biggest losers in that category. So another headline could have been "Far fewer Kiwis among the global elite - and wealth inequality is down too."

Pretty much the whole country is in the world's top 3 wealth deciles - or at least the number of Kiwis falling into the lower deciles rounds down to zero when calculating our share of those global wealth deciles. We have 0.4% of the world's top 10%, top 5%, and top 1%. We're 0.2% of the global 9th decile, 0.1% of the global 8th decile, and rounding error below that. So another headline "All things considered, we're pretty wealthy."

Anyway, go look at the Credit Suisse report for yourself. Journalists should be a bit less credulous about Oxfam's reporting on the figures, especially where Oxfam pulls this exact same stunt every year. Hunt paints a picture of wealthy Kiwis getting richer and poor Kiwis getting poorer. The Credit Suisse figures instead show we all got poorer (and wealth inequality dropped), but that it's mostly changes in exchange rates.

I like my headlines above better than the one the Dom picked for Hunt.

Previously:


Tuesday, 18 December 2018

Wealth inequality - reader mailbag

An informed reader reminds me of a couple points on wealth inequality in response to this morning's post:
Just saw your piece on wealth. To add to the points you make:
  • Strongly agree with your point about the use of cross sectional data. This is particularly true in a country where a large number of people in the first ten to 15 years of adulthood go abroad. We would expect the distribution to be highly skewed if the most effective means of building capital is to go abroad.
  • There is likely to be a depressing effect on saving associated with the generosity of the state superannuation scheme. Or to be more precise: people have an implicit overlapping generations model in the minds that sees long run intergenerational transfers by government as credible. This means they see the tax and transfer system as an implicit saving scheme. When combined with home ownership and universal health care, it is a reasonable question to ask what purpose would it serve people in the lower half of the income distribution to build up assets? (there is a paper by Andrew Coleman somewhere on this)
Both points are good. The latter one especially should be better recognised. NZ Super guarantees you a decent basic retirement income. NZ Super currently pays $926 per fortnight if you're single, or $701 per fortnight per person in a couple. After tax, it's $617 per person in a couple. 

So a retired couple gets $1234 per fortnight after tax in NZ Super, so $32,000 per year. That's in the middle of the second decile of equivalised household income for a couple, before housing costs. So anyone earning less than that could easily be forgiven for not building any retirement savings: they would be reducing their current consumption in order to gift themselves higher consumption in retirement than they were ever able to afford when working. What does that mean? It is completely rational for the lowest income twenty percent of the population to not be building wealth. 

Or, to put it another and perhaps better way, we should view NZ Super eligibility as being equivalent to lump sum wealth holdings for each person, rich or poor, equivalent to the present discounted value of the stream of entitlement payments once you turn 65. But that's not all! Government provides other services as well. There's a retirement care subsidy (which draws against your Super entitlement, but also involves additional subsidy from the government). Government provided health care too. Entitlements to all of these should be viewed as part of the lump-sum entitlement that's fairly evenly distributed. 

And what happens to any inequality measure if you ignore a giant lump sum that's provided across-the-board? The inequality measure will overstate real inequality. 

Household net wealth

My take on the latest Stats NZ Household Wealth survey is a bit different from Max Rashbrooke's.

Here's Max:
The Household Net Worth survey by Statistics New Zealand shows the wealthiest one percent have 20 percent of all assets and the wealthiest tenth have 59 percent. The poorest half of adults - 1.8 million New Zealanders - have just 2 percent of all wealth. Māori net wealth is significantly lower than that of Pakeha.
These figures are broadly unchanged since the last such survey in 2015. But that's barely reason to celebrate.
Wealth - in the sense of things that people own, like houses, cars, financial investments and cash in the bank - provides security and stability. It is something people can draw on during tough times, a stake in the community, a base from which to plan for the future.

So it is hugely concerning that so many New Zealanders have so little wealth. And their position is not improving. Statistics New Zealand reports that the poorest 40 percent have seen no increase in their wealth in the last three years.
But look at the chart underlying this:
There was a half a percentage point increase in the number of people with net wealth of less than $100,000: those will be people with substantial debt. When I check the student loan tables, about 0.075% of the domestic population has student loan debt into those figures - the rest has to be other stuff. 

Once we get into the positive net wealth categories, every net wealth category up to and including the $400-500k band had a smaller proportion of the population falling into it. Most bands above that saw an increase in the proportion of the population in the band, barring the $700-900k group. And the proportion of people with more than $1.5m in net wealth increased from 8.3% of the population in 2015 to 12.5% of the population in 2018.

It would then be fair to characterise this as an overall upward shift in wealth, barring a small increase in the proportion of the population with substantial net debt.

The median person in 2015 would have been in the $200-$300k net wealth range. The median person in 2018 is in the $300-$400k net wealth range. But note that the figures are not inflation adjusted.

The overall curve looks to me to have shifted to the right, barring the increase in the proportion of people with substantial net debt of more than $100,000. All the focus on what proportion of the population has what proportion of overall wealth misses what looks like an overall increase in wealth.

And recall too that life-cycle stuff enters heavily here. These annual snapshots give a picture of the cross-section in any particular year. But people accrue wealth as they age, then start consuming from that wealth in retirement. Stats' press release has young people (age 15-24) with median net worth of $2k and older people (age 65-74) with net wealth of $416k. 

Every year, new people are born, existing people age, and some people die. Looking at annual snapshots doesn't tell us anything about how people move through the life cycle. Every person in 2015's bottom 40% could have increased in wealth, with no change to the wealth band of 2018's 40th percentile person, as the 2015 people move up through the age ranks and new people come in at the bottom. 

I'd also be pretty nervous about claims around the proportion of wealth held by different quintiles if substantial net debt held by a small proportion counts at the bottom. Some of it is student loan debt where the human capital generated by that education is not counted in the wealth tables - but only a small amount. I wonder if some of it is mortgage debt where the corresponding housing asset is held in a family trust not included in the wealth. Does it really seem likely that anybody would lend over $100,000 to those unlikely to be in a position to be able to pay it off? 

Tuesday, 4 September 2018

The Equalizer

My column in last week's National Business Review ($) went through a new StatsNZ series on government spending on health and education by income quintile. 

A snippet:
Statistics New Zealand’s latest figures show that while households in the highest income quintile spend about $150 (or about 38%) more on education services than households in the poorest quintile, government spending on education services is about $1100 higher for households in the poorest quintile. Central government education spending in 2015-16 averaged just under $1500 for households in the highest income quintile and just over $2600 for households in the poorest quintile – despite tertiary education spending that skews toward richer households.

A more thorough analysis would and should adjust for age differences across households in different income quintiles; that work is impossible from the data released.

Government service effects

We can look, though, at the effect of government spending on in-kind transfers like health and education on one measure of inequality: the ratio between the highest and lowest quartile, or the Q5:Q1 Ratio. That ratio has a lot of problems as well, not least of which being that it takes annual snapshots of household incomes and misses how household income moves over an individual’s life cycle. But it does let us get a handle on the effects of government services.

Gross disposable income, which includes taxes and cash transfers, is about six times higher in the top 20% of households than in the bottom 20% of households. Adjusted disposable income adds in government spending on in-kind transfers like health and education. Once we adjust for those in-kind services, the ratio drops by a third.
Richest quintile as multiple of poorest quintile.

Wednesday, 24 January 2018

Wealth inequality and Oxfam, again

Every year, Credit Suisse puts out its new databook measuring global wealth. And, like clockwork, Oxfam follows it up a few months later with calls to liquidate the wealthy.

Here follow some fun facts from the Credit Suisse report that provides the data that forms the basis for the Oxfam stuff.

At the end of 2000, New Zealand had 0.1 percent of the world's adults and 0.2% of the world's wealth. Mean wealth per Kiwi adult was USD $67,275; median Kiwi wealth was $30,078. By comparison, the global median wealth per adult in 2000 was $1,867.

By mid-2017, New Zealand still had only 0.1% of the world's adults but had managed to scrounge up 0.4% of the world's wealth: wealth per NZ adult rose to USD $337,441 and median wealth per adult rose to $147,593. Meanwhile, global median wealth per adult rose to $3,582.

Mean Kiwi wealth is five times higher than it was in 2000; median Kiwi wealth is 4.9 times higher. Global average wealth grew 1.8 times over the period and global median wealth grew 1.9 times.

Pretty clearly, Kiwis are doing something to steal wealth from the rest of the world. Because that's the only plausible reason that one person's wealth grows more quickly than another's, right? If Kiwis' wealth had kept pace with international norms, which are presumably fair, New Zealand's median wealth would be $57,750, not $147,593. The median Kiwi has almost $90,000 that should rightly have been shared around to poorer people internationally. And if mean wealth had tracked international norms, average wealth per adult would be about $120,000, not $337,000. Tracked across the 3.4 million adults in New Zealand, that's $735 billion dollars of unfair Kiwi wealth. The couple billionaires that are the focus of Oxfam's Five-Minutes Hate (NZ edition) have about eleven billion between them.

Okay, enough snark, though it is fun. Back to Credit Suisse.

NZ enjoyed the world's fourth highest percentage increase in total household wealth from 2016 to 2017, and the sixth highest in per-adult terms. In total, NZ households are $132 billion dollars richer than they were last year.

As for distribution, NZ's wealth gini is reported at 72.3. The median country's gini is 71 and the mean country's gini is 69.8. If you pull the pdf into an Excel table and sort by wealth gini... actually no. Here it is in a Google Sheet so you can check for yourself.

Anyway, New Zealand winds up being the 80th most unequal country in the world, or the 92nd most equal - on the Gini measure. Pretty middling. The world's most unequal country is Venezuela. After that, and in order, it's Kazakhstan, Egypt, Namibia, Ukraine, South Africa, United Arab Emirates, Bahrain, the US, the Bahamas, Hong Kong, and Thailand. Sweden is the 17th most unequal country on this measure. Germany is 42nd, followed by China at 43th. You have to go past Canada at 71st and the UK at 72nd and the Netherlands at 75th before you get to New Zealand at 80th most unequal.

And Myanmar, where 99.3% of the population has less than $10,000 USD in wealth, is the most equal, with a Gini of only 31.

The plot below is surely too small to read, but the hover-overs might work. If not, hit the link to the Google Sheet above.


New Zealand is a wealthy place. 1,971,000 adults have over USD $100,000 in wealth. Forget per capita stuff: that puts us, in sheer numbers, as having the 26th highest number of people with wealth over $100,000. We also have 201,000 people with more than USD $1,000,000 in wealth - a lot of Auckland houses, if owned mortgage-free, would put you in that tier. 

The wealth decile tables are even more interesting. They sort the world by wealth, split it into deciles. Then they report what fraction of the world's (say) bottom decile live in each country. New Zealand has only a tiny fraction of the world's population, but we have 0.1% of those living in the global bottom decile. Why? You can borrow money for education in New Zealand, resulting in negative measured wealth, making you less wealthy, on paper, than someone living debt free on $1.90 per day - and less wealthy than any newborn. At Table 6-5, we see that New Zealand's bottom decile's share of New Zealand's wealth is negative.

At Table 6-1, we find that New Zealand has 2.1 million people who are in the global Top 10%. And remember that their data's on New Zealand's 3.4 million adults.* So the median adult in New Zealand (again - half have more, half have less) is easily in the global Top 10% by wealth. And 301,000 are also in the Global Top 1%.

If we look at the fraction of wealth held by the top 1% in New Zealand, it shows up at 23.8%. Is that high? They provide that data for a set of 39 countries. Among that set, the fraction of wealth held by New Zealand's top 1% is the world's ninth lowest. The top 1% in New Zealand have a smaller fraction of national wealth than the top 1% in the UK, Spain, Canada, Greece, Romania, Korea, Norway, Finland, Germany, Ireland, Denmark, Singapore, Israel, the US, Poland, South Africa, Sweden, India and more. Did I say Sweden? Yes. Sweden's top 1% own 41.9% of Sweden's wealth.

If you look at the top 5% instead, New Zealand's got the 9th lowest again. If you shift to the share owned by the top 10%, New Zealand's 11th lowest out of 39; Sweden is second highest. 

Takeaways:

  • Mean and median wealth in NZ, as reported in the Credit Suisse data, have increased considerably since 2000. One measure of inequality is the mean/median ratio. If the average increases by a lot more than the median, that suggests that the gains are disproportionately at the top. Here, it's almost rounding error between the two. The mean is 5 times higher than it was in 2000; the median is 4.9 times higher. It would be... odd... to look at that and conclude that all the gains are for the rich. If that were true, growth in median wealth would have been much smaller than the growth in average wealth. 
  • If you want to rail against Top 10%ers, well, the median Kiwi adult is in the global top 10%. 
  • New Zealand is very middle-of-the-road when it comes to global wealth inequality as measured by Gini. 
  • If you want to look instead at the proportion of wealth held by the top 1%, top 5%, or top 10%, New Zealand's rich have much smaller fractions of national wealth than do the rich in Canada, Finland, Norway, Germany, Denmark, and Sweden. Among the 39 countries assessed, New Zealand's rich have between the 9th and 11th smallest wealth shares. 
I suppose I'm glad that global poverty has declined so much that charities that used to spend their time trying to help the global poor now can spend their time doing this stuff instead. 

Oh, and do note all the caveats from previous iterations on this stuff (links below). A pile of what's going on for wealth measures winds up reflecting US dollar exchange rates. That won't affect wealth shares within countries but will affect measures of global inequality and measures like "This richest billionaire has as much wealth as the world's howevermany hundred million poorest people, including a pile of people with net debt due to student loans in rich countries and another pile of people outside of the US whose measured wealth dropped because the US exchange rate went up. That'll also affect the number of Kiwis making any year's iteration of the global Top Whatever Percent. 

Previously:
* I'm pretty sure that they're using an adults denominator here rather than total population. But I can't guarantee it. If they're using total population, then the median Kiwi is just shy of the global top 10%.