Friday 30 October 2015

CURF and turf

Here's what you need to do if you want an anonymised 1% sample of the US Census.
  1. Go to Google and type US Census 1% sample, click on link to the Census.
  2. Download each of the state files from the FTP site and merge them yourself. Or just check things out for one of the states. Whatever you like.
  3. Start mucking about to test whether your pet theory is plausible.
Here's what you need to do if you want an anoymised sample of the NZ Census, or a Confidentialised Unit Record File (CURF) of any of big Stats series:
  1. Go to Stats NZ's site, here.
  2. Follow the instructions below:

Application process

CURFs can be accessed through the following process. Please contact us if you need help at any stage:
  1. Complete the CURF application form.
  2. Statistics NZ will assess the application and will ask you to provide further information if necessary.
  3. If the application is approved: 
    • the appropriate CURF licence must be signed by a person authorised to sign on behalf of the researcher's organisation 
    • each researcher who will have access to the CURF must sign the appropriate researcher undertaking 
  4. The CURF is supplied to the lead researcher.  

Assessment criteria

All access to microdata is at the discretion of the Government Statistician.
Consideration will be given to applications for CURFs that meet the following criteria:
  • The research is for a statistical purpose. 
  • The researchers have a proven history of research, or will be supervised by someone with a proven history of research. 
  • The researchers have the support of the organisation that employs them (eg, government department, university, or independent research firm).
  • The organisation supporting the research is based in New Zealand.
  • The researchers for the project using the CURF are based in New Zealand.

Methods of access

Once the application is approved, CURFs can be downloaded via secure internet access. Researchers must keep the CURF secure and ensure that the CURF is only accessible to approved researchers. Researchers can use the CURF at their workplace but data cannot be stored on a laptop, memory stick, or other portable device. All copies of the CURF data must be destroyed at the end of the research project.
CURFs are licensed for a 12-month period. The researcher can request a licence extension at the end of this period if further use is required.
Note that you can only use your CURF for the purposes set out in Schedule A of your application. So if there's some other hypothesis you wanted to check out, you need to clear it first.

If you have a hunch about something and want to see whether it's worth further checking out, America makes it easy. In New Zealand, you need to make application, wait, make sure you specified exactly what you might want to do with it, then buy a desktop computer because your laptop isn't good enough.

And the government wonders why NZ social scientists, funded by the government, rarely bother doing work on NZ data. It's a pain in the ass. Sure, it's possible. But you have to bear reasonable fixed costs to test whether an initial hunch is worth following up.

Earlier this week, I was reviewing one of our researcher's projects. They'd cited an interesting bit of American data. It would have been dead simple to check whether the same relationship bore out in the New Zealand data - just a couple of cross-tabs. But it would take all that rigamarole.

Why can America manage to provide its anonymised samples to anybody with a web browser while we have all of this?

Living wages - Wellington edition

Wellington Council's voted to require its security contractors to pay their employees at a higher wage rate.

David Farrar walks us through Council CEO Kevin Lavery's objections to what his Council has voted to make him do. In short, it is very likely illegal. Here's Lavery:
So my advice is simple – adopting the Living Wage for the security contract is a step too far. There is compelling evidence that you would potentially fail to meet your fiduciary duty to ratepayers. There is a serious risk that you would be acting beyond your powers. You would be purchasing the service for 19% extra without any corresponding improvement in service levels or productivity. You could also set a precedent for other contracts which would cost the Council tens of millions annually.  You would also be failing in your duty to me as a good employer. And you run the risk of tarnishing your reputation.  Could a responsible public body really make a decision against clear legal and officer advice only to be directed by a Court to reverse its decision? There is also a very real risk that your enthusiasm for expanding the Living Wage could undermine the good progress achieved with our own workforce. Remember that the WCC Living Wage adopted for our own staff and CCO staff has not been tested in a court of law. A successful judicial review on the expansion of the Living Wage to contractors may encourage further challenges on its adoption for our own workforce. A defeat here would have very serious consequences as the decision has already been implemented.
We should note further that extending the Council's mandated living wage to include all contractors skews the pitch against contractors, who might compete with council-owned suppliers on cost grounds. Mandate that everybody pay very high wages and contractors' cost advantages erode.

Previously:

Sideloading supermarkets

Suppose that there were a problem with kids drinking in a supermarket parking lot in Wellington.

Among the things that the police can already do about it:
Instead, the police are opposing the supermarket's liquor licence renewal. 

I suppose that eventually having a ban on all downtown alcohol sales barring pricey craft beers could help the police to keep their rostering costs down

* The default in NZ is that you are allowed to drink in public unless there is a ban in place on open liquor in those specific public places.

** The story notes that the police did have one blitz on public drinking in that supermarket. I doubt it would take many of these to stop the problem.

Banking tradeoffs

Suppose that you were a libertarian who had to decide between two banks.


The second one is owned by the government but has been told off for failing to comply with anti money-laundering regulations. If the police asked them for data, maybe they wouldn't be able to find it. 

Doesn't seem that hard a choice, really.

Apologies for the hiatus. Last week brought the launch of our newest report, and a fair bit of follow-up work. Posts on that to follow, and your regularly scheduled service soon to resume.

Update: nobody really comes out well in New Zealand, where deference to the police is pretty ingrained - as Rodney Hide points out in today's print NBR. 

Saturday 17 October 2015

Alcohol, cardiovascular risk, and the NZ Heart Foundation

I'd chided the NZ Heart Foundation for ignoring the cardiovascular benefits of moderate drinking in their heart-health calculator. In comments over at SciBlogs, the Heart Foundation said why:
Heart Foundation says:

Hi Eric,
The reason the Heart Foundation doesn’t include alcohol consumption in its heart age forecast tool is because the relationship between alcohol and cardiovascular disease is so complex. Our general advice is not to consume alcohol as a way of lowering your risk of heart disease. Although the most up to date scientific research suggests there may be some benefits of alcohol for reducing heart disease for some people, this is not the case for everyone, even when consumption is low or moderate. For most people there will be little, or no, overall benefit. Because the research is inconclusive, we don’t include alcohol consumption in our forecast tool.
However, there are many other things with a much stronger evidence base that people can do to reduce their risk of heart disease. These include giving up smoking, eating a healthy diet and exercising regularly. More advice is available here http://www.heartfoundation.org.nz/healthy-living
Kind regards,
Heart Foundation
I'd there replied with a reasonable list of recent articles demonstrating clear cardio benefits of moderate drinking.

Vox this week summarised the literature and reached the same conclusion I did. There are clear cardiovascular benefits from light to moderate drinking. Here's their article and their research summary. I'll note that when they say that there's increased risk after a drink a day, that's increase relative to the point where the health benefits are strongest. If you're looking at all-source mortality risk and comparing to a non-drinking baseline, there remain net health benefits up to about 3-4 standard drinks per day - beyond that, and there's increased risk.

Friday 16 October 2015

Monetary policy needs mates?

Here's Brian Fallow at the Herald.
The European Central Bank and Bank of Japan are printing money, and while the US Federal Reserve has at least stopped doing that, it is apparently in no rush even to start lifting interest rates from the emergency levels it cut them to during the crisis. Such heavy dosages of monetary stimulus carry serious side effects. They have inflated asset markets around the world, including the Auckland housing market.

The IMF warns that "The main medium-term risk for advanced economies is a further decline of already-low growth into near stagnation, particularly if global demand falters further as prospects weaken for emerging market and developing economies."

Countries (such as New Zealand) which are not fiscally constrained and which significantly rely on net external demand should ease their fiscal stance in the near term, especially through increased infrastructure investment, it says.

Fiscal conditions in New Zealand are likely to become more stimulatory regardless of any policy change, simply because of the "automatic stabilisers" as unemployment rises and revenue growth slows.

But the IMF is right to call for more than that.

It is a bit too easy for the Government to leave the task of moderating the cycle entirely to the Reserve Bank.

That task, never easy, is especially difficult in the current international environment, governor Graeme Wheeler said in a speech on Wednesday.

As the saying goes, monetary policy needs mates.
Fallow's article could make sense if, say, NZ monetary policy were already near the zero bound and they'd not figured out how to run less conventional moves. But to the extent that monetary policy needs mates in New Zealand, it needs help in keeping Auckland house prices from spiralling ever upwards. It doesn't need help in any fiscal demand pushes. Fortunately, Chris Parker over at Auckland Council seems to be making some headway.*

With inflation having been below the bottom of the policy targets agreement bound for a heck of a long time, and interest rates nowhere near the zero bound, it isn't right to say that monetary policy needs mates in preventing unemployment. It's closer to right to say that monetary policy's barely been tried.

Mike Reddell raises a few pertinent points here. 


* Here's the nice part on Auckland:
Item 13: Housing Supply, Choice and Affordability: Trends, Economic Drivers and Possible Policy Interventions
Chris Parker, Chief Economist for Auckland Council, spoke to the committee on his recently completed report Housing supply, choice and affordability; Trends, economic drivers, and possible policy interventions, which was publicly released on Wednesday 30 September 2015.
The report identifies a range of levers on both the supply and demand side that could be considered to address the housing affordability problem in Auckland.
Following a recommendation in the report, the committee decided to endorse a target of bringing down the ratio of median home purchase price-to-median household income to five to one by 2030. The ratio is currently nine-to-one. [emphasis added]
It also agreed in principle to include the target in the forthcoming refresh of the Auckland Plan and noted that the council needs to continue to work in partnership with the Government if this housing affordability target is to be met.
Mr Parker says including this target in the Auckland Plan is a really positive step towards making housing more affordable. “It will help shape and focus our thinking moving forward. It will provide us with a tangible, achievable goal to frame up the decisions the council needs to make to create the world's most liveable city including affordable housing", says Mr Parker.
The committee also requested that the council progress the next stage of the Auckland’s housing affordability work by undertaking further analysis and advice on the issue of housing affordability in consultation with Government agencies, to be completed in February 2016.
The Chief Economist’s housing affordability report was commissioned by Mayor Len Brown and Deputy Mayor Penny Hulse. It is an independent economic think piece and is not council policy. However, it will help inform the council's ongoing strategy for action and advocacy. It is availableon council’s website.
Kudos to Chris!

Thursday 15 October 2015

Default risk - nudge edition

Kiwisaver, founded on the premise that people are too quick to stick with defaults, finds that too many people stick with its default plans.

Recall that the whole thing was based on the idea that opt-out plans have more subscribers than opt-in plans: defaults matter. If the default is that you're out unless you actively opt in, fewer people opt-in than would opt-out if you flipped the default around.

And it was set up with pretty conservative fund default options. New workers entering jobs would be default opted into conservative funds - not typically the most recommended option for new workers, although perhaps there's a caveat in New Zealand where some could be using Kiwisaver for a house deposit rather than retirement.

Here's the default fund at Westpac (chosen only because they were the default into which I was set when I started the new job).
Default members (being members who have been allocated by Inland Revenue to the Westpac KiwiSaver Scheme because neither they nor their employer has not chosen a KiwiSaver Scheme) have their contributions invested in the Defensive Fund. The Defensive Fund aims to provide stable returns over the short to medium term with low levels of volatility and investment risk. The Fund invests primarily in income assets but is required by the Instrument of Appointment (under which, the Government appointed us a default KiwiSaver provider) to have an allocation to growth assets of not less than 15% and not more than 25%. Returns will vary and may be low or negative at times. This Fund is suited to investors who have a low risk tolerance or are investing for a short investment timeframe.
NBR chatted with KPMG's head of financial services:
“A lot of people are staying in the default schemes assigned to them when they sign up and, while at least they are in KiwiSaver, it shows they are not thinking too much further about what it means.”
And Morningstar agrees:
Morningstar research manager Elliot Smith says this is a concern, and assigning default members into conservative funds is a major flaw of the system.

“In Australia, most default funds are in the growth or aggressive categories, which is far better aligned with the long time horizon of investing for retirement.”

However, he says some providers are actively trying to get members to determine their appropriate risk profile and switch.
 Treasury's shown that Kiwisaver's not done much to overall savings rates. But if it's affected portfolio choice where too many folks reckon the default must be good enough or the government wouldn't have set it as the default, well, we have to be careful with nudges.

O-Ring models and NZ productivity

The long low-productivity tail of firms isn't just a New Zealand problem. Here's Alex Tabarrok on a new OECD report. The key image is this one: the gap between frontier firms and everyone else is becoming huge.

 productivity

Tyler Cowen wonders whether this might be due to O-Ring production models. Where the highest valued stuff requires having zero screw-ups at any point down the line, the returns to having no screw-ups start increasing hugely.

As Alex points out in this helpful explainer, the top firms pay the most across all tasks, even the low value tasks, because they can't afford to have anything go wrong.


I suspect that this is, in part, behind New Zealand's fairly flat inequality stats. We don't really have many of the frontier firms, so we don't get frontier firm salaries, so we don't have the run-up in top salaries - and it's not really to the country's longer run benefit either.

Here's Cowen:
Yesterday Alex outlined the facts, which I take to be not in dispute. Firms at the frontier have seen significant productivity gains, the others not so much. Alex calls this a “lack of innovation diffusion” and considers whether IP law might be one cause.

My framing is somewhat different. The result reminds me of the international trade literature on why so few firms export. The notions of increasing returns to scale, and fixed costs to trade abroad, provide the beginnings of an answer. In such a setting, let’s say the world has become more globalized, more IRS, and more based on learning curves, much of those trends being attributable to information technology. In that case we would expect a growing bifurcation of firm productivity outcomes, just as we find a strong bifurcation of export outcomes, with a relatively small percentage of firms doing most of the international trade, or innovating, as the case may be. The “only a small percentage of firms export” and the “only a small percentage of firms are on the productivity frontier” may sometimes even be the same way of describing the same basic fact.

The on the ground reality I observe is that the large, famous, exporting firms put together fantastic O-Ring teams of talent in a way the smaller, medium-size enterprises do not. That is the relevant diffusion barrier, but of course there may be limits on that diffusion as well. Eliminating barriers across firms is a good idea but not enough either.
It's worth thinking through the implications for New Zealand.

Wednesday 14 October 2015

Creeping bans

Not satisfied with banning sodas for sale at hospital cafes and shoppes, they're now looking to also restrict diet soft drinks and smoothies.
The Nelson Marlborough District Health Board may move to extend its ban on sugary drinks, the board's principal dental officer says.
A ban on the sale of drinks with added sugar from cafes and stores at Wairau Hospital, in Blenheim, and Nelson Hospital was introduced at the beginning of last year. 
The policy prevents the sale of soft drinks, energy drinks and flavoured milk on hospital premises.
Diet drinks, smoothies and fruit juices were not included in the policy. 
However, the board's principal dental officer Dr Rob Beaglehole said the health board might move to follow the lead of three Wellington district health boards, which not only banned drinks with added sugars but also prohibited the sale of drinks with artificial sweeteners and limited the volume of juices and smoothies. 
This would mean diet soft drinks, such as Diet Coke and Coke Zero, could not be sold on hospital grounds. 
"Emerging evidence suggests that not only are the diet soft drinks detrimental to teeth but that they are also a contributing factor to obesity and type two diabetes," Beaglehole said. 
This isn't the first time I've heard the argument that diet drinks are no better than the sugary kind for overall health. They have fewer calories but the calories in sugary things aren't the only problem.

But consider what this sort of thing means for those pushing soda taxes. Would it mean broader taxes on soda (diet or not) plus juice and smoothies and whatever Starbucks now makes? Would soda just be a foot in the door for expansion to other drinks?

Note that the article above is a couple weeks' old now - I'd missed it first time round.

Tuesday 13 October 2015

A climate bet - any takers?

So these stickers have been going up around Wellington.


Much of Wellington is built on land that rose up out of the harbour in the 19th century during one of Wellington's charming earthquakes. A climate change advocacy group's been putting up the stickers.

I hate climate scaremongering. It too easily leads people to dismiss both the sensible and the crazy versions of the argument.

And as I view bets to be a tax on bullshit, I'm happy to offer 10:1 odds against the 2040 shoreline being at any of the current 1840 shoreline markers. I offer the bet on Caplan's terms. Here's Caplan's terms on a recent bet against a European war:
You pay me $x today.  If any European country that was not Communist in 1988 has a civil war leading to 10,000 or more fatalities between today and December 31, 2045, I will immediately pay you $7x.  Germany counts, Turkey doesn't.  Any front page story in The New York TimesWashington Post, or Wall St. Journal stating that a literal civil war in one of the specified nations has led to 10,000 or more fatalities in that nation ends the bet in my opponents' favor.  If I die before the bet resolves, the bet ends and my heirs keep the money.
I am willing to accept up to $500 on this wager, committing me to pay up to $3500 if I lose.  Per my current rules, I will bet anyone willing to pre-pay me via Paypal.  If there is any doubt about my reliability, note that (a) I frequently bet, and have never been accused of non-payment, (b) I am a public figure with reputation to lose, (c) I have a stable address, having been a GMU professor for 18 years, (d) I am 44 years old, so am quite likely to survive until 2045.  Multiple betting partners have accepted such terms in the past.  
You may accept these terms in the comments or via email.  The bet officially begins when I receive payment.
I'm offering 10:1 against the 2040 shoreline being at the 1840 position due to climate change. The bet is cancelled in the event of a major Wellington earthquake that changes the shoreline position substantially. I'm happy to take liability of up to $15,000 on this one, in total across all those betting against me.

I'm 39 years old and so likely to be alive in 2040. I've never been accused of non-payment of a bet, but I haven't bet nearly as often as Bryan. I am a public figure with reputation to lose, though less than Bryan's. My address is less stable than Bryan's but I'm exceptionally easy to find. 


Picture HT: Nathan Ross

Catastrophes are complicated

There are lots of potential catastrophes out there, each of which might be worth spending something to avoid. So how should we decide things in a world of multiple catastrophic scenarios? Martin and Pindyck show that things get messy quickly. [ungated]

You can't run a catastrophe-by-catastrophe cost-benefit assessment and just work your way down the list: as each has a big potential effect on current consumption (through taxes to provide mitigation) or on future consumption (if the catastrophe happens, or cumulative effects of the mitigation works), which catastrophes you want to avoid has to be decided simultaneously across all projects.

Here's perhaps an easier way to think about it. Your expensive home renovation works might pass cost-benefit for you. Upgrading the car might also pass cost-benefit. But if you do the renovations, the car upgrade will no longer make sense because you won't be able to afford to eat, and the same if you do the car upgrade before the renovations. So you need to look at them both at the same time. Worse, if part of the home renovations is to keep the garage roof from wrecking the car, then the car upgrade is pointless if you don't do the renovations.

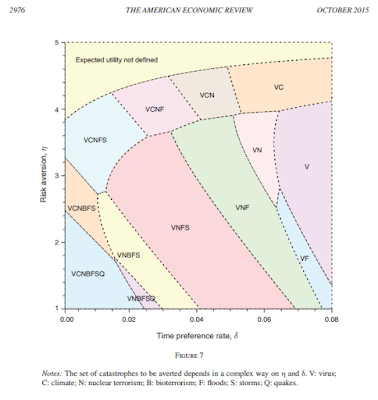
How things map out then depends on both your time preference rate and on your risk aversion. Here's the results of some simulations over seven potential catastrophes, with their rough modelling of the effects.

With low values for time preference and for the risk aversion parameter, it makes sense to pay to avoid a pile of potential catastrophes. As those change, so too does optimal mitigation.

I note that they left out the catastrophe that worries me: asteroid impact. 

Monday 12 October 2015

Tobacco targets

In a New Zealand that cared more about harms from tobacco use than about bashing tobacco companies, we'd expect to see things like:
  • Legal and simple access to nicotine cartridges for e-cigarettes. They could be accompanied by a very low excise tax and sold through licensed outlets, like tobacco, under an R18 regime, if the public health folks worried about sales of an addictive but relatively benign substance (coffee?). 
  • A regime providing excise scaled to harms for different tobacco products. If heated rather than smoked products were less harmful, they should be available on a lower excise rate. And similarly for snus or for chewing tobacco. 
Instead, what do we get? New Zealand gloating over that tobacco was exempted from investor-state dispute settlement provisions in the TPP, hints that more tobacco excise hikes are coming, and the Prime Minister noting that he'd like to implement tobacco plain packaging.

Surely we're well into massively diminishing returns on the bash-tobacco side. Why not put the effort instead into getting legal markets in less harmful alternatives with an excise regime that's sensitive to the relative harms of the different products?

Sure, tobacco excise hikes will continue to cut down on the number of smokers; demand curves do slope downward, and especially in the longer term. But at current excise levels, the ones left are surely the least price sensitive. We know that the price elasticity of demand for products with close substitutes is much greater than the price elasticity of demand for products with no close substitute. And we know that the current regime is highly regressive for those households that continue to smoke

Why not open up the market to less harmful substitutes? Isn't it just a bit nuts that e-cigarette users have to import their nicotine capsules from abroad, where they have much harder recourse if they're provided adulterated product?

Update: here's the anti-smoking campaigners' wishlist from last week
Sane treatment of e-cigarettes wasn't mentioned anywhere.

Friday 9 October 2015

TPP Tech

David Farrar summarises the great work NZ's IT community did in ensuring that the TPP deal was reasonable on IP. Sure, there are a few bits in there that are less than ideal - extending the duration of copyright on existing works is always absolutely nonsensical (as compared to extending it for new works, which is more debatable). But compared to the stuff that was giving me nightmares, this is pretty good.

Here's MFAT's IP summary. Key points for me:

  • The copyright extension won't pull works out of the public domain but will delay new accessions to the public domain for works currently under the 50-year protection;
  • The government will not criminalise uses that are currently legitimate;
  • The government will maintain exemptions from TPM provisions for things not infringing or where there's an existing exception: like breaking the region-code on a DVD; breaking TPM to reformat for the disabled; breaking TPM to reverse engineer things;
  • Current copyright exemption for temporary electronic copies is maintained (which could matter for some interpretations of geounblocking);
  • No major changes to ISP liability;
  • No changes to parallel importation.
And I'd elsewhere seen that NZ can maintain its position on software patents. 

I'd commented on TPP briefly on Radio Live earlier in the week. Talkback callers were up in arms that NZ might lose some of its current protections against that foreigners might buy things here. I noted that while it would be desirable to be rid of the overseas investment restrictions, arrangements like that were explicitly carved out of the deal:
Existing regulations inconsistent with TPP obligations are carved out of the agreement. New Zealand will therefore continue to screen foreign purchases of sensitive land, including farmland, through the Overseas Investment Office and require that these meet a “benefit to New Zealand” test. 
Labour seems mad that they'd be blocked from banning foreign purchasers from buying existing houses; hard to take seriously claims that they'd pull out of the TPP over it though.

Thursday 8 October 2015

What's your model?

Labour is mad that the TPP might preclude them from one of their preferred policies: banning foreigners from buying existing houses. They expect that forcing foreign buyers to build new houses rather than buy existing ones means more houses get built.

There is an issue here: because regulatory constraints make new building incredibly difficult, foreign money wanting to be in NZ housing generally winds up in existing housing.

But I am curious about the underlying model. The number of houses built will depend on demand for housing, not demand for houses per se. Suppose that total demand for buying houses is split between foreigners and domestic residents. If total demand is enough to bring more new housing on-stream, I have a hard time seeing how it matters, for the total stock of housing, whether foreigners are required to build the new housing or whether they can buy existing.

The only way I can make sense of things is if we assume that foreigners don't care about the returns in housing and only want to park money here to hide it from their home country. If your view of the world is that a Chinese billionnaire is happy to lose some of his money by investing in too much Auckland housing because he'd lose more by keeping the money in China, then forcing him to invest in new dwellings could change the total amount built. But didn't the IRD changes make that kind of story implausible?

I'd like to know what Labour's implicit model is here.

Terry Anderson: Condliffe 2015

Terry Anderson will provide the University of Canterbury's Department of Economics and Finance's 2015 Condliffe Memorial Lecture.

If you're in Christchurch, do attend. Anderson is excellent. He's particularly good in environmental economics and indigenous economics.

Here's the blurb [Update: it runs 6-7 pm]:

2015 Lecture:
Environmental Markets: Lessons from and for Fisheries Management

Terry Anderson

Presenter:
Terry Anderson
Property and Environment Research Center (PERC) and Hoover Institution, Stanford University

When: Tuesday 17 November,
Where: LAWS 108 Lecture Theatre, Business and Law Building (Google map link)


In this lecture, Dr Anderson will discuss Free Market Environmentalism and the approach of using property rights and markets to address environmental problems, focusing on lessons from and for fisheries management in New Zealand.
Refreshments will follow the lecture. RSVP to: meredith.henderson@canterbury.ac.nz

Abstract

Increased demand for environmental amenities and competition for scarce natural resources require rethinking how we manage our natural environment. The dominant management institutions have focused on top-down command-and-control regulations. Though some of these regulations have been successful in picking low hanging environmentalfruit – especially in reducing air and water emissions – they have not harnessed private initiative by using property rights and markets. This approach under the banner of “free market environmentalism” shows remarkable promise for dealing with a variety of environmental problems. Fisheries management in New Zealand illustrates the potential for this approach if the necessary market institutions can be buttressed and improved. In short, environmental markets offer a promising alternative for the next generation of environmentalism.

About the speaker

Terry Anderson is the William A. Dunn Distinguished Senior Fellow and former President and Executive Director of PERC as well as the John and Jean De Nault Senior Fellow at the Hoover Institution, Stanford University. He believes that market approaches can be both economically sound and environmentally sensitive. His research helped launch the idea of free market environmentalism and has prompted public debate over the proper role of government in managing natural resources. He is the co-chair of Hoover's Property Rights, Freedom, and Prosperity Task Force.
Anderson is the author or editor of thirty-seven books. Among these, Free Market Environmentalism, co-authored with Donald Leal, received the 1992 Sir Antony Fisher International Memorial Award. A revised edition was published in 2001.
Terry and Donald Leal’s forthcoming book, Free Market Environmentalism for the Next Generation, will be published in 2015. His most recent publications are Environmental Markets a Property Rights Approach (Cambridge University Press, 2014) and  Tapping Water Markets(RFF Press, 2012). Other books include Greener Than Thou: Are You Really an Environmentalist? (Hoover Institution Press, 2008) andProperty Rights: A Practical Guide to Freedom and Prosperity (Hoover Institution Press, 2003), both co-authored with Laura Huggins. His book, with Peter J. Hill, The Not So Wild, Wild West: Property Rights on the Frontier (Stanford University Press), was awarded the 2005 Sir Antony Fisher International Memorial Award.
Anderson’s research, which has also focused on Native American economies, recently resulted in a co-edited volume, Self-Determination: The Other Path for Native Americans (Stanford University Press, 2006). He has published widely in the popular press and professional journals, including the Wall Street Journalthe Christian Science Monitor, Fly FishermanJournal of Law and Economics, and Economic Inquiry. During his career at Montana State University, Anderson received several outstanding teaching awards and is now professor emeritus of economics. He received his B.S. from the University of Montana and earned a Ph.D. in economics from the University of Washington. In March 2011, Anderson received the Liberalni Institute Annual Award in Prague, Czech Republic, for his "Contribution to the Proliferation of Liberal Thinking, and Making Ideas of Liberty, Private Property, Competition, and the Rule of Law Come True.” Previous recipients include Nobel laureates Milton Friedman, Gary Becker, and Vernon Smith.
Anderson is an avid outdoorsman accomplished at big game hunting, bird shooting, fishing, skiing, and hiking.

Wednesday 7 October 2015

Flag Cycles

I guess we'll never know whether the flag referendum has chosen the right flag. Why? Elections NZ cannot tell us.

Let's step back. Recall that the preferential ballot that will be used would provide us all the data we need to choose a Condorcet winner, if there is one. The Condorcet winner is the flag that would beat all other flags in a head-to-head match-up. So if my preferred flag, monkey-butt, would beat each of the fern designs and the red peak design in a head-to-head match, monkey-butt would be the Condorcet winner.

It's dead simple to check for a Condorcet winner in the preferential ballot. For each of the pairings, you pretend that all the other options don't exist and see how many voters say A beats B and how many say B beats A. If a majority of voters rank A higher than B in their preference ordering, regardless of how they rank them relative to all the other options, then A beats B. You do that across all the potential options. If some flag would beat each other option, that's the right flag.

Unfortunately, a preferential ballot with sequential elimination of options that receive the fewest first choices can sometimes choose the wrong option. Suppose some flag is everybody's strong second choice but the first choice of few voters. It could be quickly eliminated from the preferential ballot. It isn't necessary that a Condorcet winner exists, or that a preferential elimination would fail to choose an existing Condorcet winner, but it is definitely possible and it is definitely easily avoided. How? Before running the preference ballot, check to see if any option beats all the others and declare it the winner if so.

Even more unfortunately, we'll never know whether we've chosen the wrong flag. The Electoral Commission replied to my request as follows:
Dear Mr Crampton, Thank you for your e-mail of 24 September 2015 regarding the results of the first flag referendum and a request to provide the number of votes that conform to each of the potential preference orderings and publish the aggregates.

Section 38(1)(a) of the New Zealand Flag Referendums Act 2015 (‘the Act’), provides that in the case of the first flag referendum, once all the voting papers have been processed, the Returning Officer must:
(i)     calculate the number of first preference votes received for each option; and(ii)    count the votes in the manner described in Schedule 4; and
(iii)   declare the result of the referendum by giving public notice of the following:(A)     the absolute majority of votes determined at the first iteration; and(B)     the number of first preference votes received for each option; and(C)     the absolute majority of votes determined at each iteration at which an option was successful or excluded; and(D)     the number of votes recorded for each option and the number of transferable votes at each iteration at which an option was excluded; and(E)     the iteration number at which each option was excluded, where applicable; and(F)     the number of informal voting papers; and(G)     the outcome of the referendum; and 

The results will be published on the Electoral Commission's website: www.elections.govt.nz in accordance with these requirements.  The preliminary results will be released after 7pm on 11 December 2015 and the final result after midday on 15 December 2015.
 

Unfortunately, the Electoral Commission is unable to provide the additional result information that you would like because it is not permitted under the legislation.
 Yours sincerely
I wonder if it's too late to get an emergency change to the referendum legislation.

Update: A follow-up email confirms that the Electoral Commission would decline any OIA requests for those more detailed vote tally breakdowns as they view it as illegal for them to provide it.

Tuesday 6 October 2015

Markets for rules

Oliver and I had a minor disagreement in last week's Insights newsletter.

He argued that the Volkswagen case was terrible and that everybody should follow the rules.*

I said that regulators and car companies have been playing cat and mouse with each other on this stuff for ages, that customers would put in workarounds if the emissions controls denigrated performance too much anyway, and that civilisation would collapse if everybody followed all the government rules all the time.

That's especially true when government sets rules to be seen to be doing something rather than because they think the rules are a good idea. You occasionally hear stories around the traps of governments doing things that they hope get overturned by the courts on appeal, so that they can have their cake and eat it too: politicians get kudos from voters for having done something feel-good and dumb, but suffer none of the economic consequences of bad regulation because some grown-up elsewhere in the system bats it back.

Are there alternatives?

The latest Cato Unbound has an excellent contribution from my old classmate Ed Stringham. He points out that government is neither the only nor the best source for rules. In fact, for a couple of centuries, governments tried to ban stock markets as being sinful gambling. So traders set up and enforced their own rules despite government trying to ban their doing so and despite government refusing to enforce contracts. And it's hardly an isolated case.

Here's Ed:
In all of the world’s first major stock markets, government officials considered much of the trading as a form of gambling or speculation used to manipulate prices. In the first stock market in seventeenth century Amsterdam, government refused to enforce all but the simplest securities contracts. After the founding of the Dutch East India Company in 1602 a secondary market for shares emerged among brokers who began specializing in trading stocks. Officials soon passed edicts outlawing their nascent market, but stockbrokers continued trading and developed many sophisticated transactions including forward contracts, short sales, and options. How is that possible? Instead of formal rules, stockbrokers relied on reciprocity and reputation mechanisms to encourage contractual compliance. In contrast to the one shot prisoners’ dilemma story, most business is repeated and brokers had to be reliable if they wanted others to do business with them. Not only would a defaulter sour his relationship with his trading partner, but he would be boycotted by everyone else who found out. Reputation thus served as a substitute to formal rules. The market was wildly successful and helped finance the Dutch Golden Age. Some estimates put the market capitalization of the Dutch East India Company in current dollars at $7 trillion. Modern New Yorkers can thank the Dutch East India Company for financing Henry Hudson’s first voyage to New York’s North River (the Hudson River) and the Dutch West India Company for founding New Amsterdam (New York).[4]

...Other financial intermediaries also assume and manage risks on behalf of customers. When doing business with PayPal or with most credit cards, if fraudsters make bogus transactions or attempt to takes money out of an account PayPal is on the hook. By 2001 fraudsters were stealing more $10 million from PayPal per month at a time when its gross annual revenue per year was only $14 million. At first PayPal contacted the FBI and found that it was of little help. After seeing the evidence, the FBI asked questions such as “What’s a banner ad?” These government officials were not at the forefront of technology, but even if they were, they still would have been powerless against anonymous fraudsters on the other side of the globe. Rather than sitting around and hoping that government would solve the problems, PayPal came up with private solutions to deal with fraud before it occurred. They developed human-assisted artificial intelligence to monitor accounts, search for suspicious activity, and temporarily or permanently suspend accounts. By assuming and managing risks on behalf of customers, PayPal transformed what many people assume must be legal questions into risk management questions. When parties can deal with problems ex ante, ex post contract enforcement is not the “necessity” that theorists like Kirzner or Olson assume.

* Hic-A-Doo-La means obeying all the rules!
Hicadoola


Wage gaps and part-time work

I had a look at the latest numbers over at The Initiative's blog:
Last week’s New Zealand Income Survey sure led to a lot of headlines. Here are some of them:
One simple change could almost halve measured pay inequality. What is it? Have women replicate men’s split between full-time and part-time work. Ok, maybe that’s not so simple. But while there are 7.05 full time male workers for every part-time male worker, there are 1.96 full time female workers for every part-time female workers. And part-timers always earn less than full-timers. Interestingly enough, part-time female workers earn more than part-time male workers – for the obvious reason given those numbers.
If you re-weighted the pay gap using women’s median earnings for full-time and part-time work, but men’s split between full-time and part-time work, the pay gap would drop from 11.9% to 6.6%. And that’s without controlling for a pile of other important stuff, like time spent outside of the workforce or differences in education background and the like.
How is this different from last year? Last year’s wage gap was 9.8%. In the 2014 NZIS, there were 6.65 full time male workers for every part-timer and 2.02 full-time female workers for every part-timer. So the proportion of male workers in full time positions increased while the proportion of women in full-time positions decreased. The absolute number of part-time male workers dropped; the number of part-time female workers increased.
How big is the effect? It looks like the change in the relative proportions of part time and full time workers accounts for about a fifth of the increase in the wage gap from 2014 to 2015. The rest looks due to a much stronger increase in male full-time earnings than in female full-time earnings – though part-time male earnings have stagnated while part-time female earnings grew.
Meanwhile, the Herald is blaming "bro culture" for that women take longer to pay off student loans than men.
The latest Education Ministry report on the student loan scheme says male students who graduated in 2011 will pay off their loans in an average of 6.7 years, but women will take a further six months.

The gap is far smaller than 2005, before student loans were made interest-free.

In 2005, men would take an average of 14 years and women 28 years to pay off their debts.
Hmm. Any guesses about something that might happen for at least some women in the first 5-10 years after college graduation that would mean an income-contingent loan repayment scheme might take longer for women than for men? Any?

And recall that student loans here don't accrue interest if the debtor stays in New Zealand. If the numbers above are right, then inflation eats far more of female graduates' debt burden than it does for males. Think about it this way. If you owe a big pile of money on which zero interest is accruing, would you prefer to be able to pay it off really quickly or have it deducted from your estate on your deathbed? The longer the term of a zero-interest loan, the better for the borrower!

Update: Brennan McDonald points out that student loan balances are written off when the government sees your death certificate.

Monday 5 October 2015

Obesity and Income

If we're tallying the social costs of obesity, what should we make of this one?
Obese men make more money than their slimmer counterparts, according to new research from the University of Otago's Christchurch Health and Development Study (CHDS).

The opposite can be said for women, with obese or overweight women earning less than women of average weight.

They were also more likely to be depressed and dissatisfied with their lives, while an obese man's mental health was generally unaffected by his girth.

The study analysed the relationship between a person's size, using their Body Mass Index (BMI), and financial aspects of their lives such as net weekly income, savings, household income. They also examined depression levels and life satisfaction.

On average, men with a BMI of more than 30 – the classification for obesity – earn $140 a week more than men with a normal BMI. Obese women earn $60 less than a woman with a "normal" BMI rating.

...The study has followed the lives of more than 1200 Canterbury children in intimate detail for 38 years. ... They decided to examine the CHDS cohort at age 30 and 35 to try and identify a link in New Zealanders.

The study found being overweight or obese was associated with poorer outcomes, but only in women, Horwood said.

"There was a clear relationship between larger men and larger weekly pay packets. But for men, being classified as overweight or obese according to the BMI Index did not negatively affect other outcomes measured in the study such as self-esteem or mental health," he said.
I've been unable to find the study referred to. The reporter says it is available in the Social Psychiatry journal, but I've been unable to find it on either the International Journal of Social Psychiatry's website, or on the "Social Psychiatry and Psychiatric Epidemiology" site. And I've not been able to find any journal that's just called Social Psychiatry. Not for the first time, I wish online news articles included links to cited studies.

Bigger picture, wage effects of consumption behaviour shouldn't count as any kind of external cost. They're effects born by the person undertaking the consumption and, potentially, others with whom that person is linked through a contractual nexus. If someone is less productive and he's paid less, does it matter whether it's due to drinking, obesity, or wanting to flip to part time to spend more time playing video games, or wanting to flip to part time to spend more time with the kids?

Life of Brian

The NZ Film Classification Office today pointed to its amusing 1980 correspondence around Monty Python's Life of Brian - an excellent film that I saw when I was maybe 14 years old.

Here's the Office:
Monty Python's Life of Brian (1979, R16)

The classification of the 1979 film Life of Brian was hotly debated both in New Zealand and overseas. Christian groups in New Zealand called for the film to be banned before the it had arrived in New Zealand. Chief Censor of Films Bernard Tunnicliffe received more letters about Life of Brian than any other film submitted for classification at that time. Life of Brian was classified according to criteria set out in the Cinematograph Films Act 1976 and on 18 February 1980 was classified as restricted to those aged 16 years and over (R16). Many correspondents who had requested a ban on the film were upset with the R16 classification.

A petition was launched in July 1980 requesting that the Minister of Internal Affairs withdraw the film from public release. While the petition gathered 12,352 signatures it was unsuccessful in convincing the Minister to stop the exhibition of the film. There were also members of the public who supported the R16 classification of Life of Brian. One parent wrote to the Chief Censor telling him that they initially thought that the film should be classified lower than R16 because they thought that their 12 year old daughter would have enjoyed most of it, however they "commend(ed) (his) refusal to ban it and the rating (he) awarded it". Another letter to a newspaper editor from Monty Python fans in Lower Hutt pointed out that they were "…distressed by the number of Christians that object to the film and believe that…if the film upsets them, they shouldn't go and see it…Life of Brian is purely meant for enjoyment and the only one restriction should be made only — those with a sense of humour need go".
Archives New Zealand pointed to some of the correspondence around it too. Silly religious people wanting to ban the film.

Film Censor's Office Correspondence - Monty Python's Flying Circus What's less funny is that that 1980's ruling still stands. Because Christians were powerful enough, in 1980, to ensure that the film received an R16, and because it hasn't been re-classified, the ruling still stands. And now that you know that it is R16, the maximum fine is $10,000 and you could go to jail for up to three months. Section 126.

Regardless of the censor, I'll likely show the film to the kids when they're in their early teens.

The Classification Office notes that anybody can submit a film for reconsideration. I'm not going to. Monty Python specialised in sending up the absurd; the film's current rating is an absurdity highlighting the rather substantial deficiencies of the system.

Friday 2 October 2015

Marsden Maths

Motu's released the working paper they'd presented at the NZAE meetings earlier this year. They show that Marsden grants do increase research output. But as for whether the programme is cost effective? Well, that's more fun.

The average researcher on teams receiving Marsden grants made 6 proposals and received 1.2 grants over the period 2000-2012. The Fund allocated just under $68 million in 2013; the standard grant's maximum budget is $300,000 per year while Fast Start grants are limited to $100,000 per year. Panels reject 71-84% of first round proposals. The Motu analysis looks at second round proposals, 41% of which were funded.

Results? Here's the big headline chart from their press release.


So about the biggest effect that they found was that a researcher who received two successful research grants received a 10% increase in publications and a 14% increase in citations. In the regression discontinuity design, comparing project teams whose proposals just made the cut with those that just didn't, they found no effect.

Their abstract's version:
Overall, we find that funding is associated with a 6-15% increase in publications and a 22-26% increase in citation-weighted papers for research teams. For individuals, funding is associated with a 3-5% increase in annual publications, and a 5-8% increase in citation-weighted papers for 5 years after grant; however, the lag structure and persistence of this effect post-grant is difficult to pin down. Surprisingly, we find no systematic evidence that the evaluation of proposals by the Marsden system is predictive of subsequent success. We conclude that the Marsden Fund is modestly successful in increasing scientific performance, but that the selection process does not appear to be effective in discriminating among second-round proposals in terms of their likely success.
An annual 8% increase in the number of citation-weighted papers for five years after a grant might amount to one full paper over the entire time period. A research grant costing upwards of a hundred thousand dollars per year seems a pretty costly way of generating one citation-weighted paper.

It would be ... interesting ... to compare the cost-effectiveness of Marsden with an alternative scenario in which academics who maintained a reasonable publication record received an unconditional grant and the money spent on Marsden-related administration went instead into hiring more academics. There have to be at least 30 full-time equivalent academic-years that go into Marsden grant writing and grant evaluation.

Income confusion

Today's NZ Income Survey numbers have me perplexed. I've emailed asking them what's up, but here's my puzzle. Maybe one of you can help me out.

I keep median and average weekly earnings from salaries and wages floating around in my head because they're important touchstone figures that everybody working in policy should know. They give you a sense of proportion for things. The number I had floating around in my head for average weekly earnings from salaries and wages among salary and wage earners was $991. And that is the correct 2014 figure. Median was $863.

This year's release has a population rebasing taking into account the 2013 Census and they urge that current figures not be compared to prior ones because they've rebased things. Ok, fair enough.

This year's release has median weekly income from salaries and wages at $882, which is up $19 from last year. Last year's median figure was $863, so whatever's going on in the rebasing didn't affect the median figures. $863 + $19 = $882. A 2.2% increase.

The headline figures didn't include averages though, and they usually do. For those, you have to drill over to Tab 5 of the spreadsheet. Average wage and salary income for those in paid employment was $891. And they do not provide a rebased figure for 2014.

Whatever happened in the rebasing didn't affect median earnings at all, but knocked average earnings down by over ten percent. Average earnings didn't drop: all the hourly rates and such are increasing, and the average earnings from salary and wages across the entire population (not just those in employment) is up, but they don't give the version of average earnings that would allow a straight comparison of averages among those in paid employment.

I'm probably missing something obvious. But I just don't buy that there's only a $9 difference between median and average weekly earnings. If there is, well, even I've been massively overestimating the amount of inequality in New Zealand - and I've been complaining about other folks overstating it.

Update: StatsNZ replies:
"Regarding to your query, median weekly income from wages and salaries for those receiving income from this source was at $882 in the June 2015 quarter, compared with $863 in the June 2014 quarter.
The average was at $1,021 in the June 2015 quarter (which can be found in the supplementary table 4), compared with $993 in the June 2014 quarter.
The figures above are calculated based on wage and salary earners only.
 However, figures in table 5 are calculated based on the people earning income from either wages and salaries or self-employment, or both.
As the population is different, the average of $891 is different, compared with $1,021 mentioned before.
 Hope this could help answer your question."
So it's the relatively low earnings of those reporting self-employment that drag down the Table 5 averages.


3 Strikes

It looks like New Zealand's version of three-strikes for criminal offending is working. Here's Graeme Edgeler's analysis. [IMPORTANT UPDATE December 2016 - SEE BELOW]
You need to be careful when crafting OIA questions around this sort of comparison, and I am relying on the Ministry of Justice to have correctly understood my intention. It is not enough to compare the number of convictions before and after the law change. Almost a third of convictions for “strike” offences since three strikes was enacted haven’t attracted first warnings because they relate to offending that occurred before the law change. You need to exclude similar offending in the comparison.

Between 1 June 2005 and 31 May 2010, 6809 people received convictions for strike offences that occurred between 1 June 2005 and 31 May 2010.

Between 1 June 2010 and 31 May 2015, 5422 people received convictions for strike offences that occurred between 1 June 2010 and 31 May 2015. So strike crime is down around 20% since three strikes came into effect. Claiming cause and effect over something like that is the type of intractable debate that you get into over the effect of longer prison sentences. But what we are looking at is not the general deterrent effect of three strikes (fear of punishment in the public at large), but specific deterrence: fear of punishment by those who have a conviction for strike offending who have been personally warned by a judge that further strike offending is treated very seriously. And that is where we can check the comparison between the five years before three strikes and the five years after it.

We know there were 81 second strikes in the first five years of three strikes. These are people who have been convicted for committing a strike offence after the law came into force, and subsequent to that conviction, been convicted of a further strike offence, itself committed after their earlier conviction occurred. The pre-strike comparison therefore needs to be people convicted of an offence committed after 1 June 2005 (but before 31 May 2010), who were then convicted before 31 May 2010 of a further offence committed after that conviction. And it turn out that that number is a lot higher. Had the three strikes law been in place on 1 June 2005, the following five years would have seen 256 offenders receive second strikes.

Now, strike crime is down in general, but the ~20% fall in strike offending is dwarfed by the ~62% fall in strike recidivism.
And here's where it gets really interesting:
Because of the lack of retrospectivity in our three strikes law, two people convicted on the same day, in respect of the same charge can have different strike consequences: someone convicted for offending that occurred after the law came into force receives a strike warning, but someone convicted of an offence committed before the law was enacted receives no warning.

A comparison between these two groups may help confirm or quash the alternative hypothesis that some change in treatment is the cause of the substantial reduction in strike recidivism.

In the first 4 years and 7 months of three strikes (curse you tier one statistics!), 2437 people have been convicted of strike offending that did not result in a strike warning, and of those, 360 had subsequently earned a first warning for an offence committed after that conviction. That’s a strike recidivism rate over 1000% higher among those who didn’t receive a warning than those who did. Of course, this direct comparison is misleading, as the post-strike convictions for pre-strike offending will be front-loaded, occurring on average much earlier in the ~5 year period since three strikes was enacted, and thus allowing more time for strike-level recidivism to occur. However, it remains useful, as it provides evidence to negate the alternative explanation for the pre-strike/post-strike comparison of much improved recidivism treatment.

And that is what we are left with: in the first five years of three strikes, there were 81 second strike convictions. In the five year before three strikes, there would have been 256.

81 second strikes seemed low. Now we know it is.
It looks like everything is there for a proper full difference-in-difference analysis, but ocular least squares here seems to be pretty strong.

A full set-up would compare the year t+1, t+2, t+3 and so on recidivism rates of those convicted of a first strike offence for offending that happened before and after the regime and of other offences before and after the regime.

Were I at Canterbury, I'd be begging Graeme for his data as basis for setting a Masters thesis and putting in the OIA requests for the finer-grained data that could let it happen.

UPDATE: Graeme has found that his early and later data was not comparable, and so has retracted this analysis.

Thursday 1 October 2015

Banned

An interesting Twitter exchange between the NZ Classification Office and Graeme Edgeler:
Some people are cut out for jobs like that; I can't imagine doing it.