
Showing posts with label Alcohol Healthwatch. Show all posts

Friday, 15 November 2019

Confusing the Monster-Ometer with the Frog Exaggerator - again

The latest results from the NZ Health Survey are up.

And so is Alcohol Healthwatch's take on those stats. They take it all as reason for tightening control on alcohol.

Go and have a look at the stats for yourself. For each of a pile of indicators, MoH slices up the data by gender, by age, and by ethnicity. It then says whether the difference between the latest stat and last year's stats, or 2014/15's stats, or the 2011/12 stats for the series that go back that far, are statistically significant.

Now one immediate problem is that if you've sliced up the data two dozen ways and you're running comparisons between three pairs of years for each of those slices, you've got a lot of potential comparisons. 24 comparisons per indicator times 3 year-pairs of comparisons, for the indicators where they have data going back over the whole period - which they don't for some because they changed their definition of hazardous drinking along the way. 

When you're slicing the data that way, you need to adjust your statistical tests for the problem of multiple comparisons. Why? Jellybeans. I'm pretty sure that MoH hasn't done that and that they're just running naive tests for each one.*  
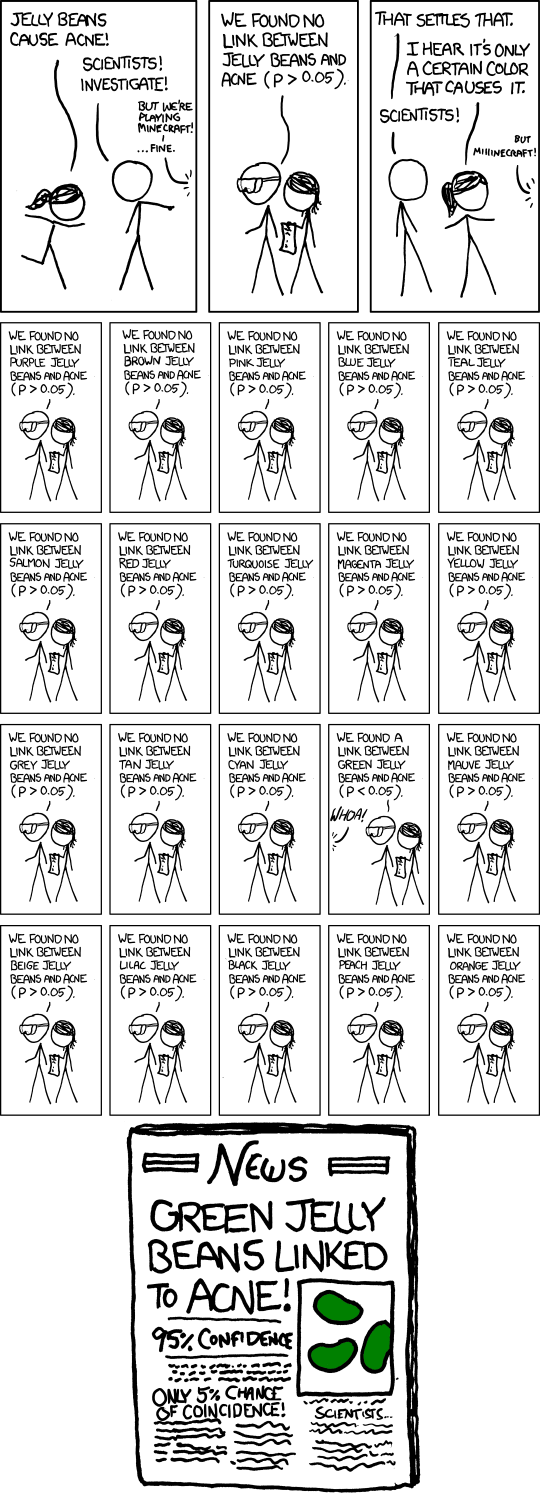

So keep that in mind when noting changes that pop up as significant. Some of those will really just be noise. 

While the mean prevalence figures cited in each group are not age-standardised, the p-values are. 

Here is the full list of all statistically significant changes across the indicators. They always compare 2018/19 to 2014/15 and to 2011/12 when those years can be compared; I don't know why they don't run comparisons to the start of the series in 2006/07. The 2006/07 figures are almost always higher than the current ones. For most stuff, there was a big drop between 06/07 and 11/12, then a flattening. 
  • Past year drinking. There are 72 potential comparisons. One is down. Twelve are up. And 59 are unchanged. 
    • Up from 78.7% last year to 80.3% this year, an increase significant at p=.05. But not significantly different from 2011/12 (lower, but not significantly) and not significantly different from 2014/15 (higher, but not significantly). 
    • Down among 55-64 year olds when compared to 2011/12 (but not when compared to 2014/15 or 2017/18)
    • Up among 75+ when compared to 2011/2 or 2017/18, but not when compared to 2014/15
    • Up among Maori when compared to 2011/12 or 2017/18 but not when compared to 2014/15.
    • Up among Maori men when compared to 2017/18, and up among Maori women when compared to 2011/12 (but not the other years for either)
    • Up among Pacific when compared to 2017/18, and up among Pacific women in every year comparison
    • Up among Asian women when compared to 2017/18, but not when compared to 2014/15 or 2011/12
    • Overall this looks like a bit of an increase on last year's stats, but still more than three percentage points down on 2006/07 (to which they don't make comparisons). 
  • Hazardous drinkers (AUDIT score 8 or higher, among total population). Here there are only 24 potential comparisons because their data doesn't go back earlier than 2015/16 because of a data redefinition. 
    • Across those 24 potential comparisons, there are zero statistically significant changes. 
    • Looking at the changes without looking at significance, compared to the start of the period, 8 of the 24 are higher and the rest are lower. Compared to last year, 17 of the 24 are higher and the rest are lower. 
  • Hazardous drinkers again, but this time restricted to the set of those who consumed alcohol in the past year. Same drill as last time on the years of data. And, same as last time, zero significant changes out of 24 comparisons.
  • Heavy episodic drinking (at least 6 standard drinks), at least monthly, total population. I don't think 3 pints of decent beer is heavy, but I suppose these things are subjective. 24 potential comparisons because of year restrictions. One statistically significant change over last year: a drop among those aged 75+. That's it.
  • Same thing again, but restricted to past-year drinkers: identical. A drop among those aged 75+, no other statistically significant changes. 
  • Heavy episodic drinking, defined as before, total population, except this time at least weekly. 
    • Up among men; Up among those aged 18-24, Up among those aged 15-24, Up among European/other men - all as compared to 2017/18. The remaining 20 comparisons are unchanged. Doesn't look much different for those as compared to 2015/16, but they don't run that comparison. 
  • Heavy episodic drinking, at least weekly, among past-year drinkers.
    • This time, it's only up among European/other men. None of the remaining 23 comparisons are significant. 
So. We've got 240 comparisons. Of those, 17 show statistically significant increases, 3 show statistically significant decreases, and 220 show no change. I was doing eyeball-counting here, so let me know if you've caught a miscount. 

If they've not adjusted the p-stats for multiple comparisons, we've likely overstated the number of significant results. 

If you want to use a Frog Exaggerator, you can point to some of the significant changes among the 240 potential comparisons and say that they're big. But folks should know you're using a Frog Exaggerator rather than a Monster-Ometer.


And while the old and new indicators on hazardous drinking aren't comparable, we might expect that the direction of change in the measures would be comparable. There were big drops in hazardous drinking among youths 15-17 from 2006/7 to 2011/12 on that earlier measure, then a flattish trend after that - and similarly for those aged 18-24. Over the longer period, drops among youths are washed out by increases in older cohorts. Hazardous drinkers, among those 15-17, dropped by over 40% from 2006/7 to 2015/16, and dropped by about a quarter among those aged 18-24. Any recent flatlining should be read in context of prior unmentioned drops in youth hazardous drinking. 

Similarly, consumption of 6+ drinks at least weekly on the old measure showed that 25.6% of 18-24 year olds were in that category in 2006/07, with prevalence dropping to 20.6% in 2011/12 and then bouncing around to land at 15.1% in 2015/16 - a drop of over ten percentage points over the interval. By the new measure, prevalence in 2015/16 was 20.4%, dropped to under 17%, then came back up to 21.1% in 2018/19. So that's an increase on last year, but it will still be a decline on 06/07.


* Update: MoH confirms that they're reporting the unadjusted stats. That's all fine - there are plenty of folks who'd need the naive t-stats. But it does mean that if you're looking across the set of them, you need to remember that you probably need a tighter threshold for the p-values. 

** For those who don't know that excellent Simpsons episode: Professor Frink thought he'd found the Loch Ness monster. The machine was going nuts with beeping. But it was just a frog. Why? He was using the Frog Exaggerator rather than the Monster-Ometer. One might ask why he bothered bringing a Frog Exaggerator out on that scientific expedition in the first place. But good on Frink for letting everyone know he'd accidentally pulled out the Frog Exaggerator. Not everyone does that. 

Friday, 22 June 2018

Alcohol healthwatch - again

"One-third of NZ's hazardous drinkers are now aged 35-54," says Alcohol Healthwatch executive director Dr Nicki Jackson.

"For the older groups, hazardous drinking is now higher than it was back in 2006/07. It feels like we have a new 'peak booze' among parts of our population."

The Ministry of Health estimates that over 780,000 adults are hazardous drinkers. Statistics NZ figures show the drinking habits for more than a third of people aged 18-24 could be potentially hazardous - regularly consuming six more drinks in a single session.

Dr Jackson warns there's been an increase in hazardous drinking every year since 2011, and says it's increased by more than 50 percent among those aged 45 to 64 years.

As well as this, hazardous drinking in the 66-74-year age group more than doubled from 2011/12 to 2015/16.

"Our older drinkers are some of the heaviest drinkers in the world," she says.
Let's go back to the stats.

The 2015/16 New Zealand Health Survey does have an increased prevalence of harmful drinking (AUDIT score 8 or higher) for total population in each year from 2011/12 through 2015/16. But that came after a substantial drop from 2006/07. So the 2015/16 figure is now a bit higher than it was in 06/07. The rise from 11/12 to 15/16 is statistically significant, but there is no significant difference between 05/06 and 11/12.

While 32.6% of those aged 18-24 were considered hazardous drinkers by that standard in 2015/16, 43.2% were considered hazardous drinkers in 2006/07. It's been flat on "about a third" since 2011/12. The drop from 06/07 to present is significant; there's been no significant change though since 2011/12.

There were statistically and real-world significant drops in the prevalence of hazardous drinking from 06/07 to 15/16 for cohorts under the age of 24. Prevalence among 15-17 year olds roughly halved (19.5% to 11.5%); among those aged 18-24, it dropped by about a quarter (43.2% to 32.6%).

There was no statistically significant change over the period for those aged 25-34 (though higher now than before, with a large rise from 14/15 to 15/16), or for the 75+ cohort (which dropped from 3.6% to 2.9%).

There were statistically significant increases in prevalence from 06/07 through 15/16 for 35-44 year olds (16.6% to 22.3%), for 45-54 year olds (12.2% to 18.5%), and for 65-74 year olds (7.3% to 10%).

So if you want to tell a story about big increases in rates, you can pull out the 06/07 data and start from 11/12, which seems the bottom of a trough, or ignore what's been happening for younger cohorts, or both. The Ministry of Health data only goes back to 06/07, but overall per capita consumption data has a massive drop from 1987 to 1997, a mild rise through 2010, then a fall through present. If overall hazardous drinking is up 2011/12 through 2014/15 despite a drop in per capita consumption, then maybe whatever the government's doing on alcohol policy is doing more to deter moderate drinkers than it is doing to affect heavier drinkers.

It's also worth looking at the other measures in that survey.

MoH tallies the proportion of people consuming 6+ drinks on one occasion at least monthly. That figure is statistically significantly down overall from 06/07 through 15/16 (22.5% to 19.3%), massively down among 15-17 year olds (25% to 9.4%), and also down for 25-34 year olds (30.7% to 26.3%).

The only statistically significant change for any other subgroups were an increase among Maori women from 2011/12 through 2015/16 (23.4 to 27.8% but as the 2006/07 proportion was 28.0%, there was no change over the longer period), and smallish drops among European men and Europeans overall.

If you flip to the "Consumption of 6+ drinks on one occasion at least weekly" figure, you get a significant drop overall, a significant drop among men, and significant drops in the under-24 age cohorts.

It's also worth checking the most recent figures.

Again, the new ones aren't commensurable with the older ones, so we only have the change from 15/16 to 16/17. The proportion of hazardous drinkers dropped from 20.8% to 19.5% in the total population, and from 26.2% to 24.7% among past year drinkers. Heavy episodic drinking at least monthly is up by fractions of a percent, but heavy episodic drinking at least weekly is down fractions of a percent. None of those changes are worth noticing, but the drop in the most recent year contrasts with Alcohol Healthwatch's "there's been an increase in hazardous drinking every year since 2011".

Anyway, your regular health warning about relying on Alcohol Healthwatch's stats applies. It's usually worth going back and checking the original data yourself to see what's been left out.

Wednesday, 15 April 2015

More things that aren't ironic: pub discounts

Somebody's not been listening to Weird Al's grammar advice: irony is not coincidence.

Alcohol Healthwatch's Christine Rogan's mad about a loyalty card scheme that would rebate 5% of members' purchases as student loan repayments. Why? Some of the retailers involved are pubs.
Alcohol Healthwatch health promotions adviser Christine Rogan said it exploited the vulnerable.

"[It's] increasing the risk that alcohol consumption is going to be encouraged through this marketing promotion.

"How ironic that the first [merchants involved] are the ones that encourage students to drink," Rogan said.

Massey University professor Sally Cresswell, who specialises in alcohol policy, said there was a "feelgood" factor to the card but the initial focus on businesses selling alcohol was a sign society still saw alcohol as an ordinary commodity, rather than a drug that should be treated with caution.

"You could just imagine situations where people are saying, 'Oh, well, let's get another round, it's all paying off so-and-so's loan', and I think that's really not appropriate."

But the card's founders say it is aimed at everyone with student loans, which included ex-students.
For a better alcohol-themed use of the word, watch the Canadian classic Strange Brew. Bob & Doug McKenzie go to Elsinore Brewery with a mouse in an empty bottle, trying to wheedle their way into getting a free case. After inadvertently stumbling on Brewmaster Smith's plans on using a special addictive drug in the beer as part of his plans for world domination, Doug McKenzie finds himself with Pam Elsinore, trapped in one of the beer vats, about to be drowned. Brewmaster Smith opens the vat, saying
How ironic. You came here with a mouse in a bottle. Now you are the mouse. ... It's really too bad you won't be around to see the whole world become addicted to Elsinore beer. In a few hours I will introduce my special formula to the public at Oktoberfest. When they drink enough, they will do whatever I tell them.
 See? It's not just coincidence. It's coincidence with that special kinda twist.

Wednesday, 26 February 2014

Alcohol Healthwatch Is Making Stuff Up, Again

Here's Alcohol Healthwatch in the New Zealand Herald.
Rising economic confidence and "aggressive" marketing techniques are the driving factors behind an 8.9 million litre rise in alcohol availability last year, says one concerned health organisation.
Latest figures from Statistics New Zealand, which compared figures over the last five years, show the total volume of alcohol available in New Zealand rose to 466 million litres last year - the equivalent of 2.1 standard drinks per person aged 18 and over per day.
It represents an increase of almost 9 million litres from 2012, according to Statistics New Zealand.
The total volume of alcohol available for consumption in New Zealand did increase last year. So too did population. We usually look at per capita trends rather than total volumes.

Go to Stats NZ's Infoshare service. I cannot link directly to the data series, because StatsNZ uses session codes that won't allow it. But the series you need is ALC005AA. Copy that into the search bar that I've linked to above. Then select all years all series. This is what you get when you port it into Google Docs to get graphs.

So, what can we see here? Per capita alcohol availability dropped substantially from 1986 to 1988, levelled off, dropped substantially from 1990 through 1996 (recall that the big liberalisation came '89), then bounced around a bit with a mild rise through 2010 followed by a mild fall. The average per capita figure for those aged 15+ was 9.4 litres over the whole period, was 9.2 litres over the period since 2000, and was 9.3 litres for the period 2003-2013. The 2013 figure was 9.2 litres. Eyeballing it, we've had a slight reversion after a substantial decline in consumption, followed by a levelling-off since 2005.

The Herald's citing Alcohol Healthwatch as saying that rising economic confidence and aggressive marketing are behind a rise in alcohol availability, using "total volume of liquid containing alcohol" as the measure. The volume of pure alcohol per capita is basically flat over the last decade, but with a mild decline from 2010 to present: the period coinciding with "rising economic confidence". And if alcohol marketing has gotten more aggressive over the last year, it's had no obvious effect on consumption. If we take Rebecca Williams at her word that the marketing's gotten more aggressive, then I guess we might start worrying less about aggressive marketing.

Let's continue. Here's more from The Herald:
However, there was concern that drinkers were moving to stronger types of alcohol as further analysis of the figures showed the percentage of beer, as a proportion of total volume available, fell from 81 per cent in 1996 to 62 per cent in 2013.
Wine rose from 16 per cent to 23 per cent, and spirits and spirit-based drinks such as RTDs rose from 3 per cent to 15 per cent in the same 17-year period.
Rebecca Williams, director of Alcohol Healthwatch, said the figures appeared to confirm fears around ready-to-drink (RTDs) beverages.
"One of the worries for us has been that the RTDs ... would be exposing those young drinkers to the spirit brands and the heavier spirits, and I think that is happening," she said.
"The spirits component has increased, wine is going up on a fairly steady basis, and the worry about the wine is that it too is actually quite a larger volume of pure alcohol [per drink], so we're seeing a shift to the heavier alcohol products."
Drinks such as wine were being marketed "aggressively" in outlets like supermarkets, as well as campaigns by drinks companies, which were competing heavily with each other, she said.
The figures could show a trend back up to peak levels in 2008.
"Seeing an increase this year, seeing the economy come back on line, all of those things to me will start to signal some concerns that we could be tracking back up again," she said, saying that "when people are feeling better [financially] they spend more on booze".
Williams is right on a couple of points. Beer has taken a declining share of total alcohol over the period since 1986, but with a very recent levelling-off. The StatsNZ series ALC016AA has the total litres of alcohol available per beverage category rather than per capita, but it's still useful for assessing relative market share across the categories. When we port it over to Google Docs, and with a bit of wrangling,* we get this:
Wine seems to have levelled off at a third of total alcohol since 2006 or so, spirits have risen markedly over the last decade, and beer's dropped. So Williams is right about that. But all of that needs to be read against the broad flatlined trend in per capita total consumption. She's painting the shift to potentially higher alcohol products as representing an increase in consumption of alcohol when per capita alcohol availability hasn't changed.

Further, is Williams suggesting that the beer companies don't market aggressively against each other? Didn't we hear a lot of outrage about aggressive beer promotion at the Rugby 7s? We can't just look at a change and blame aggressive marketing for those components that get a category increase when there's pretty similar marketing for the components that get a category decrease. My weekly supermarket flyers have more pages of wine ads than of beer ads, but there are plenty of ads for sales on slabs of beer too.

Because StatsNZ changed category definitions, we can only split out low and high alcohol spirits starting in 1995. Here's category shares from 1995 onwards:
When I look at this, I see pre-mixed, lower-alcohol spirits displacing beer rather than building demand for pure spirits. And, again, per capita consumption hasn't really grown much over the period.

Summing up, where Williams comes up with marketing- and economy-based explanations for increases in total alcohol availability and for category shifts, and worries that increased consumption of low-alcohol spirits is a gateway to harder spirits, we find instead:
  • No increase in per capita alcohol availability;
  • No plausible story explaining why marketing has been so effective for RTDs and wine and so useless for beer;
  • No plausible story explaining why improved economic conditions helped RTDs and wine but hurt beer;
  • No plausible story explaining why per capita trends in total alcohol availability show a mild decline from 2010 through 2013, the period of economic recovery, when they're using economic recovery to explain changes in total alcohol availability;
  • What looks like roughly constant market share for Beer + RTDs rather than RTDs being a gateway to proper whisky, though it's always possible that RTD drinkers will mature into spirits rather than shift to beer; either way, there's no increase in per capita availability. 
Let's then help the Herald out a bit by re-writing their first couple paragraphs for them.
The total volume of pure alcohol available per person in New Zealand remained constant this year. While there was an 8.9 million litre rise in the total quantity of alcoholic beverages available this past year, this increase is largely explained by a rising population combined with a shift away from spirits-based drinks, which have more alcohol per unit of total liquid, and towards medium-strength beer and wine, which have a lot more water with their alcohol. And, this category change mostly looks like noise given the longer-term trends.
While professional anti-alcohol advocacy groups, whose existence depends on shouting "Monster! Monster!" whenever a new alcohol stat comes out, blamed rising economic confidence and aggressive marketing for the increased total volume of alcoholic beverages, Statistics New Zealand noted that, "the volume of pure alcohol available per person aged 15 years and over (15+) was unchanged from 2012, at 9.2 litres per person." While anti-alcohol activists try to fuel the perception of crises by citing figures on the total amount of alcoholic beverage that's been available for consumption, it's best to look at statistics on per capita pure alcohol availability.
I wish that Monster-Shouting didn't sell papers.

Previously:
Update: Thomas Lumley reached a similar conclusion.

* The period prior to 1995 uses the discontinued series on total wine; from 1996 onward, I use the revised total wine series. It doesn't make much difference but lets me have a longer time series.

Wednesday, 18 December 2013

Surprise surprise suprise

Radio New Zealand reports on results from Auckland Uni's youth survey. Smoking and drinking rates among young Maori are well down. It shouldn't be a surprise to anybody. The MoH's survey shows substantial reductions in drinking among youths. But folks determined to see crises will keep being surprised.
The report shows the number of Maori youth who drink alcohol at least once a week has more than halved in the past five years - something which comes as a surprise to Alcohol Healthwatch director Rebecca Williams.
The survey bucks the trend of many other reports but, nonetheless, any indication of a move away from alcohol consumption should be celebrated, Ms Williams says.
No, the survey is entirely in line with the other data that's been coming out. These results are only surprising if your priors are so immune to updating that nothing else has been able to get through. Hard to dismiss the conclusion that MoH is paying Healthwatch on the order of $600k per year for derp herping. [Thanks Nicola!]

Thursday, 12 December 2013

Alcohol Healthwatch

From the full version of the Rankine report for AHW on women and alcohol:
The BERL analysis was critiqued for its methodology by Crampton and Burgess (2009), who called the final BERL figure ‘grossly exaggerated’ (Crampton, 2009). Crampton and Burgess estimated external alcohol costs at $662 million, which they said was almost matched by the $516 million received in alcohol taxes. Crampton and Burgess cited literature indicating that drinkers earned at least 10% more than equivalent non-drinkers, that moderate drinking increased benefits from experience and education, that moderate drinkers lived longer, and that alcohol saved more lives than it cost. They also questioned BERL’s estimate that 50% of costs were avoidable. Crampton and Burgess’s conclusions were unsupported by other research reviewed above, including studies cited in section 9.1: New Zealand health benefit estimates, and section 10: Alcohol-related health problems. 
Later, related research by Crampton, Burgess and Taylor critiquing alcohol cost studies was commissioned by the Australian National Alcohol Beverage Industries Council (NABIC). Crampton presented it to the national conference of the Australian Liquor Stores Association, and at NABIC’s request spent a day in Canberra discussing the research with media and ministry officials (Crampton, 2012).
I wish that they'd cited our 2011 working paper or the 2012 NZMJ summary version. The 2009 version, referenced by AHW as a link to the blog, contained an error that we only caught on going through the Collins & Lapsley report on which the BERL report was based. The corrected figure had social costs closer to $975 million. We also there noted that we'd missed excise revenues collected at the border, for a total excise take of $713 million. We only caught the error understating alcohol's social costs when we took this on as a paid project by NABIC. So the net effect of industry funding was to substantially increase the measure of alcohol's social cost in New Zealand; I think that AHW is trying to insinuate otherwise in the last paragraph. They didn't mention that some of my current work is industry-funded, but I expect that will change quickly enough. I'd be curious to know how much money Alcohol Healthwatch sucks out of MoH every year.

One of the biggest problems in the BERL report was double-counting. We argue that you can't simultaneously count the productivity losses associated with premature mortality and the intangible costs of lives lost where the MoT survey-based measure of the value of a statistical life is inclusive of the lost productivity. BERL added both of those together, along with a strange assumption about that the economy's at full capacity so a deceased worker can never be replaced with either another worker or more intensive use of capital. They also specifically zeroed out all of the alcohol aetiological fractions where alcohol use reduces the burden on the health system, despite that their source, Collins & Lapsley, allowed alcohol to both increase and decrease burdens on the health system, depending on the disorder.

Further, whether the excise take matches the social cost doesn't necessarily imply anything about the direction of optimal regulation. If excise does more to deter drinking's harms than to curtail moderate consumption, it's possible for it to make sense to increase excise even if the total tax take is well in excess of alcohol's social costs. Conversely, if excise does more to deter moderate drinkers' consumption and to reduce heavy drinkers' consumption mostly on non-binge days, then it's harder to justify tax increases even if the total tax take is below social costs. The latter seems to be the case. We really need cost-effectiveness measures that weigh up both the value of harm avoided and the costs imposed on non-harmful consumption for any regulatory measure, whether excise or otherwise.

If we look back to Section 9 of the AHW report, they rightly note that some early studies on the J-curve combined never-drinkers with former drinkers, but take this as debunking the J-curve entirely, citing Fillmore (of course). They ignore di Catelnuovo and Donati. They note Rimm and Moats, but in the most superficial way. They write:
Rimm and Moats (2007) restricted analysis in a large prospective study to non-smoking men who exercised and ate a good diet. They found that among these men, those who drank moderately had a lower rate of coronary heart disease (CHD) than non-drinkers. They concluded that moderate drinking reduced the risk of CHD. However, the same possible confounders may apply and there are also harmful effects from moderate drinking. For women any such benefit may be outweighed by an increased risk of breast cancer.
Rimm and Moats picked a sample of very healthy men with good health behaviours. Within that group there remained strong protective effects of moderate alcohol consumption. The possibility for residual confounding among a group pre-selected for very healthy behaviours is much lower than among a pooled group with larger unobserved heterogeneity in health behaviours. And the effect was very large. I'd summarised the overall literature a while back.

And if AHW were right that "for women they [the benefits of moderate drinking] are outweighed by health dangers from moderate drinking, such as an increased risk of breast cancer", then we would hardly expect to find that the J-curve is stronger for women than for men, albeit with peak protection at a lower level of consumption than for men. Again, here's di Castelnuovo and Donati:
A J-shaped relationship between alcohol and total mortality was confirmed in adjusted studies, in both men and women. Consumption of alcohol, up to 4 drinks per day in men and 2 drinks per day in women, was inversely associated with total mortality, maximum protection being 18% in women (99% confidence interval, 13%-22%) and 17% in men (99% confidence interval, 15%-19%). Higher doses of alcohol were associated with increased mortality. The inverse association in women disappeared at doses lower than in men. When adjusted and unadjusted data were compared, the maximum protection was only reduced from 19% to 16%. The degree of association in men was lower in the United States than in Europe.
They also cite bad effects subsequent to the dropping of the alcohol purchase age and ignore Stillman's findings.

Friday, 6 December 2013

More binge drinking reports

StatsChat reports on local hype about increased hazardous drinking among women.

A Canadian alcoholism activist is in New Zealand promoting a book. It looks like Alcohol Healthwatch has used the book tour as a hook for a report on female drinking habits in New Zealand. I was a bit surprised to see reporting on big increases in female binge drinking; there's really nothing there in the Ministry of Health data.

Granny Tut-Tut (who recently complained about Key's Nanny State) reported:
Women's alcohol consumption is on the increase, and "we don't really know why", they said, something which was hindered by "gaping holes" in the available research and data. However, they said key target areas for the Government should be pricing, how the alcohol industry markets its products, and availability.
If you don't know why something's increasing, I'm not sure you're well placed for recommending policy interventions. But what's the evidence for increasing female consumption?

 The AHW paper on which the news stories are based says the following:
One recent survey reported that between 1996 and 2012 the rate of hazardous drinking among women remained relatively stable at around 12% of drinkers25. However, other surveys indicate that women of all ages have increased their alcohol intake in the last two decades, and this has been most marked in younger women26 27 28.. The proportion of female secondary students who were current drinkers dropped significantly from 68.5% in the first Youth 2000 survey, to 45.5% in 201229 30. This is consistent with results from the New Zealand Health Survey, where the proportion of 16 to 17-year-old young women drinkers significantly reduced from 79% in 2006/7 to 59% in 2011/1231 32. However, of those secondary students who did drink, 28% had five to nine drinks in an average session in 2001, and 30% in 201233 34. About 10% usually had 10 or more drinks a session in 2012.
Ok. So we have a great big reduction in the proportion of young women who drink and a tiny increase in consumption among those who do drink. Is that our crisis? Seriously? Let's look at their cited sources on increased intake among younger women.

Footnote 25 is the MoH data linked above.

Footnote 26 is Fergusson et al. It is a survey piece offering no independent evidence on time trends. They cite only the Law Commission report on that there's any increasing trend in drinking among young women.

Footnote 27 is Freyer et al's ALAC monitor report 2009-2010. This is a fun one. They specifically say "Comparisons between years should only be made between 2005-06 and 2008-09. Comparisons with 2009-10 should not be made because of a change in the way "Moderate Drinkers" and "Binge Drinkers" has been defined. So keeping that in mind, what do they say about female heavy drinking?
  • There was a substantial drop in the proportion of binge drinkers who were women. In 2005-2006, 55% of all binge drinkers were women; in 2008-09, 31% of binge drinkers were women.
  • Some stats on all youth drinkers first. Table 8 shows a slight increase in youth non-drinkers and, among drinkers, a slight increase in the proportion counted as binge drinkers. Table 10 shows that a decreasing proportion of youth drinkers report having consumed 5+ drinks on the last occasion, though the difference isn't statistically significant. Table 11 shows that the mean number of drinks consumed by youth drinkers has been stable. Table 12 shows that the mean number of drinks consumed by binge drinkers at the last session has had no change from 05-06 through 08-09. Further, Table 14 shows a slight increase in the median age of drinking initiation, though it's still sometime between the 14th and 15th birthdays in both years.
  • Table 15 shows that the proportion of youth drinkers who were female increased from 48% to 51%, but the difference was not statistically significant. An increasing (but not statistically significant) proportion of moderate youth drinkers were female; a stable proportion of binge drinkers were female. 
I can't see any increasing drinking trend among women in the Freyer et al data. Maybe there are unpublished results providing cross-tabs by gender of the trends among all adult drinkers reported in tables 2-4, and maybe those show some kind of crisis among female drinkers, but they're not published and they're not here cited that way either.


Footnote 28 is Huckle et al's summary of trends out of SHORE data. What did they find?

  • At page 44 they note a statistically decreasing trend in drinking prevalence among women both in the past 12 months and from 1995 to 2011, though the difference is very small. The number of past-year drinkers reduced from 85% to 83%.  
  • At page 45 they find, among drinkers, an increase in drinking frequency. Women reported drinking 57 times per year in 1995 and 82 times per year in 2011. In Figure 3, they show that women aged 16-24 years showed the smallest change - eyeballing the picture, the trend for that cohort is entirely flat. Women aged 55-65 showed the largest increase in drinking frequency. However, at page 48 they find that the quantity consumed per drinking occasion went up by a quarter, from 30 ml to 37.5 ml. Young women's consumption increased from 1995 to 2000, declined through 2008, then increased again in 2011, making for a flat overall trend 2000-2011 after an increase from 1995-2000.
  • At page 49 they have the stats on heavy per-session consumption, with a five 15mL drink lower bound. I'll quote: "The proportion of young female drinkers consuming 5+ drinks at least once a week increased from 19% to 28% between 1995 and 2011 (and this was a statistically significant increase). Most of this increase, however, occurred between 1995 and 2000." The SHORE data is pretty much flat from 2000 through 2011; 2011 looks to be slightly below 2000. 
On the whole, the SHORE data is consistent with an increase in heavier drinking among younger women from 1995 to 2000 and a flat trend since then. I would be exceptionally hesitant to describe this as an increase "in the last two decades" because the increase, such as it was, was entirely from 1995-2000. The phrasing makes it sound like we have this increasing trend instead of a level shift. 

So, let's weigh this all up then. Alcohol Healthwatch says that while the MoH data shows stable rates of hazardous drinking among women, three other sources show "women of all ages have increased their alcohol intake in the last two decades, and this has been most marked in younger women". I can't see that their cites support that statement. One shows no significant trend, one just cites the Law Commission, and the last one shows an increase from 1995-2000 and a flat trend since then.

Read and judge for yourself. I can't see that there's any big crisis here.

A few other notes:
  • At page 6, they say that evidence around safe or beneficial levels of consumption has been contested, citing Corrao on cancer. Corrao also was the author of a metastudy showing the cardioprotective effects of alcohol consumption. As always, it ought to be all-source mortality that counts, not any particular condition. 
  • At page 6 they cite BERL saying alcohol causes $5.3b in health and social problem. Note that BERL retracted that figure for a smaller one after I told them that they couldn't count drinkers' excise taxes as a social harm. The other problems in that report were very large.
  • At page 8, they cite a study of residence hall students at Waikato as being representative of drinking habits among all tertiary students. At least where I went to undergrad, the residence hall students drank substantially more than the students who lived at home or elsewhere. Maybe it's different here.
  • At page 9 they claim that 44% of women aged 55-70 drink hazardously. The study they cite uses a lower AUDIT threshold than is standard. Further, the same study says that only 16% of women in that age category engaged in binge drinking over the prior year. Ahem.
  • Their measure of the prevalence of drinking in pregnancy comes from 2001; there've been a lot of public health campaigns since then.
  • Page 9 gives a pile of ethnic differences in drinking and cites trends from 1996 to 2006 but ignores all of the trend data in the 2011 MoH survey. 
The standard disclaimer on alcohol posts now applies. But it didn't apply to these prior posts: