Showing posts with label crunchy crunchy data. Show all posts

Thursday, 13 April 2017

Hypothesis testing: open data edition

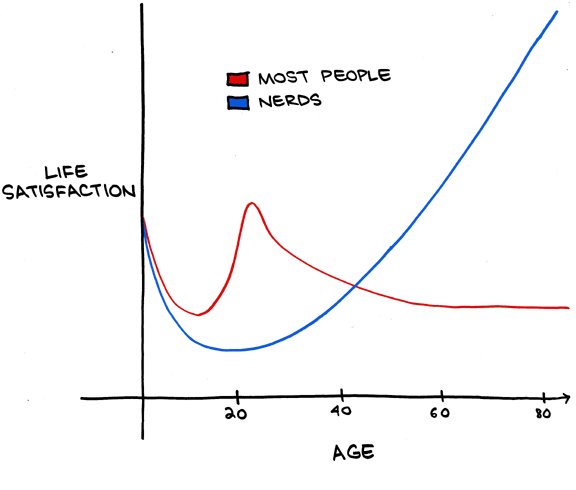
The graph looked plausible. It didn't really fit my experience, but it didn't seem implausible either.

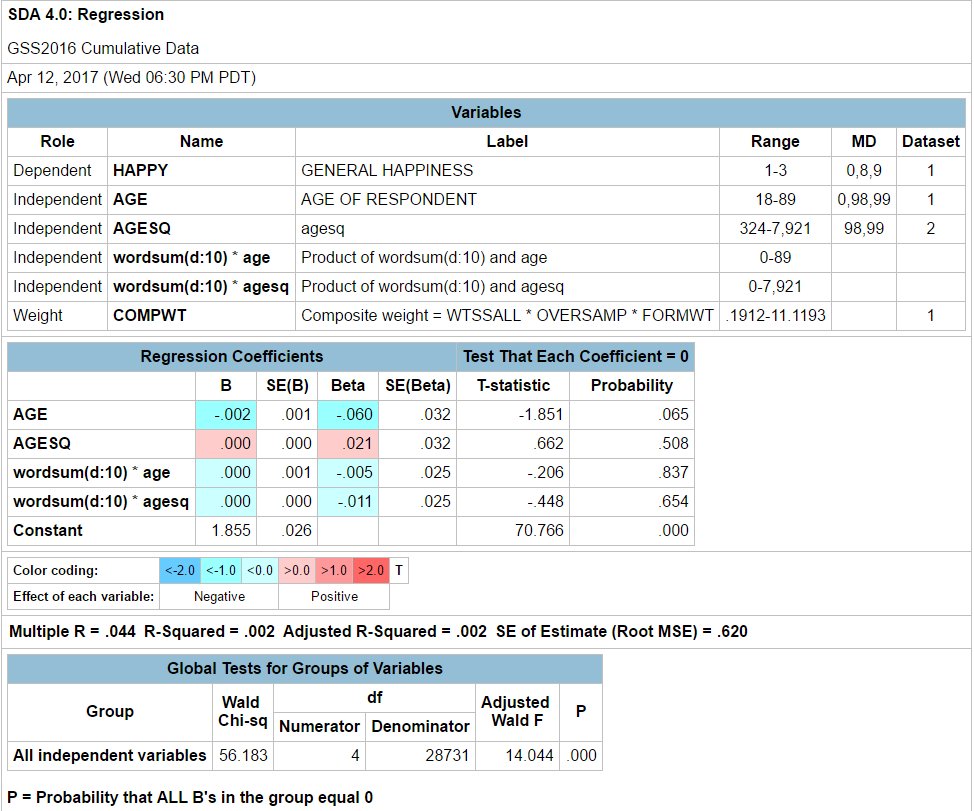
So I took a 5 minute jaunt over to Berkeley's SDA engine, which draws on US GSS data. First I ran a basic regression of happiness on age, age squared, with a high score in wordsum (a vocabulary test) as my nerd interaction term.


Berkeley lets you run the regression right in the website. I'm not sure I've got this one right - can't guarantee that I properly excluded where they used a code for missing data.

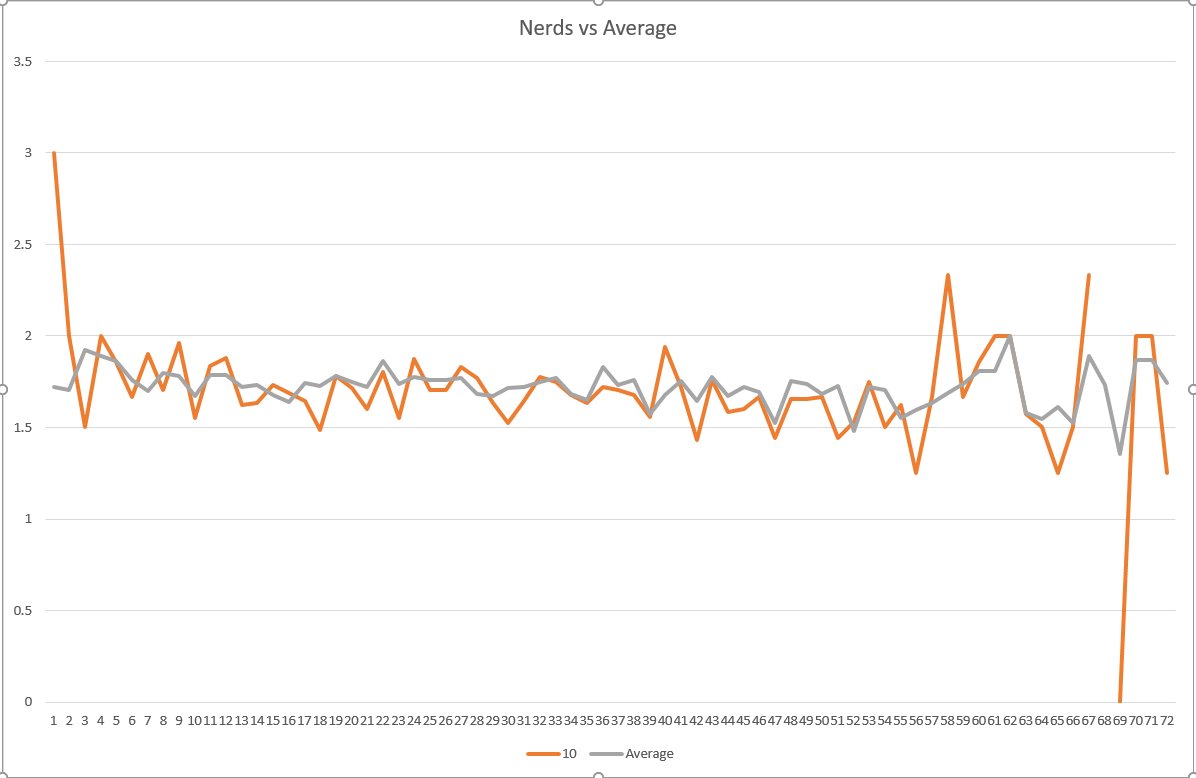
Then I downloaded the data to plot things a bit more nicely in Excel, because you can generate custom data extracts on the fly. I'd not done that before; learning how to do it took 5 minutes (mostly because I forgot to include the happiness variable the first time through). Deleted all the missing data lines. Then a quick pivot table let me plot average happiness for the top wordsum scorers against the average of all wordsum scores on happiness, by age:


The orange line is noisier - as you'd expect as there are fewer observations over which it averages at each age group.

What do we take from this? Happiness is not quadratic in age. Maybe wellbeing is, but I don't think that's in this dataset. And I can't made diddly out of any difference between top scores and the average. I'm sure there are plenty of refinements that people could make: there's great educational attainment data and other stuff in there that could better identify nerds, and maybe there is something in there that's closer than happiness is to well-being. But I didn't have more than 10 minutes to play with it.

Quick and simple real data test of a plausible-looking hypothesis. And there are plenty of reasons why splitting happiness data up by education, or vocabulary, and by age would be of more serious research interest.

Here in New Zealand, getting access to the Confidentialised Unit Record File from Statistics New Zealand would take a 3-week application process and signing a pile of forms and promising to delete the data when done with it and making sure the data is stored securely and checking with them before publishing and results from it.....

Thursday, 15 December 2016

Cataloguing Outcomes

Ever wanted to know what the government's targeting, how it's measuring outcomes, and what programmes are intended on hitting those outcomes?

Here's Superu's Treasury and Superu's Government Outcomes Catalogue Tool. The rather slick Excel tool lets you select the domain you want, the sub-domain, and filter a bit on demographic, unit or coverage basis. Hit Search and it'll tell you what initiatives are in place, the indicators they're using as measure of the stated outcomes, whether it's part of the better public service goals, and for what groups the outcomes are measured.

And some of the outcome domains:

I can't see any linkage through yet into what the figures are on the measured outcomes, but I'd expect those would come in time. At least now you can tell pretty easily what initiatives are out there, their status, and how they're intending on measuring things.

Kudos to Superu for getting this out. 

UPDATE: Credit where credit is due, and apologies. It is on Superu's site, but it looks like Treasury did the bulk of the work on this one. Apologies!

Thursday, 20 October 2016

Threatening data

AUT's Rhema Vaithianathan sees the potential for big data in the public service.
The age of Big Data has come to consumers rapidly, reinventing how we shop, socialise, bank and get from A to B. And a Big Data revolution is slowly rolling through the public sector too.

If we do this right, in 20 years or so the government ministries that currently employ thousands, and sprawl across central Wellington should each fit into a small Thorndon villa.

The vast bureaucracies of Wellington serve two main purposes.

First, they monitor. For example, ensuring that schools are open the requisite days, that police are on the beat and other taxpayer-funded services are working as they are supposed to.

Second, they collect information about these services useful for planning and policy advice. This helps the government to decide how best to spend our money. Is the existing service working? Should it get more, less or no funding? Is a new intervention needed, and how much funding should it get?

Fortunately, when it comes to monitoring and informing, Big Data can really deliver. So once our data is up to the task, these jobs won't need to be done the old-fashioned way by armies of civil servants.
It sounds great. But the power implications within government make it all a bit tricky.

It is thoroughly feasible for NGOs to ask the government to run evaluations on their own effectiveness. They can provide the government with the details on the people they're serving and what outcomes they're targeting. The government can then set a control group of people matched to the NGO's clients in IDI, or to do one better and help the NGO randomise treatment and control where the NGO can't afford to help everyone they'd like to help. Then any outcome measure they want can be tracked and evaluated: future interactions with CYF, prison recidivism, workforce attachment, child doctor visits, child immunisations - anything on which there's administrative data. And, even better, the NGO can then tell the government what their cost of outcome delivery has been.

Once that's in place, interesting things happen. Rhema notes the massive potential disemployment in the Wellington bureaucracies. One of the big advantages Ministries have over their Ministers is information. They're the ones who know things, and who can tell the Ministers things when Ministers want to know things - or refrain from providing useful information. There's a whole public choice literature on bureaucracy, agencies' information advantage over Ministers, and equilibria when Ministers can implement costly legislative control devices to help them better monitor agencies' true costs and output. Big Data, done right, can help route around it all that.

And if that can be combined with real information on the real costs of not just delivering services but of providing the outcomes that the Minister wants - that's a game changer.

In our report on Social Impact Bonds, we looked forward to a world in which any NGO or community group could pitch an outcomes project to Treasury, Treasury would tell them the current going price for improving that outcome, and the NGO would then seek investor funding to deliver the service. Whether you see the resulting data on real outcomes and real costs of providing outcomes as a bug or a feature may depend on whether you're part of a monolithic Ministry with a big information monopoly that's under threat.

Tuesday, 29 March 2016

IPUMS envy

A couple weeks back, I couldn't get NZ Census data going back earlier than the 1996 Census.

I'd then asked one of The Initiative's researchers, who's better on Stats NZ data than I am, to see whether he could find data going farther back. He couldn't. Stats replied that age breakdowns of income data, like the stuff I was doing in the post linked above, would only be available in hard copy publications from past censuses, or as a customised data job.

Meanwhile, IPUMS sends out the following email to its users:

Dear IPUMS user,

We are excited to announce new data available from IPUMS-USA:
  • A new 5% public use microdata file for 1960. This collaboration with the U.S. Census Bureau provides an improvement upon the previous 1% file for 1960. The new data contains more detailed geographic information. You can read more about the 1960 project on our website.
We will be exhibiting at the Population Association of America (PAA) 2016 Annual Meeting in Washington D.C. next week. Visit booth 512 to talk data with us.
You can download a 5% Public Use Microsample of the 1960 US Census via the IPUMS website.

In New Zealand, there's a Confidentialised Unit Record File for the 2013 Census, but nothing for prior censues currently listed. And getting access to a CURF is a bit trickier than getting access to the US PUMS.

Friday, 18 December 2015

Chinese data

Everybody knows there are problems in Chinese official statistics. But John Gibson and Chao Li have found what I think is a new one. Anything that's using regional per capita figures is a bit suspect.

Here's their abstract:
Hundreds of studies in economics misinterpret China’s sub-national population and per capita data. The most widely used population counts are of hukou registrations from each province, prefecture, county, or city rather than of the people living in each place and generating local GDP. Over 220 million people have left their place of registration, while almost none had when reforms began, creating time-varying errors in estimates of per capita income of sub-national units. We survey empirical articles in blue ribbon journals, in development journals, and in regional and urban economics journals that use China’s sub-national data. Over 80 percent of articles use these data erroneously; most commonly the wrong population or employment counts are used to measure the size of sub-national units, and per capita data are calculated with the wrong denominator for the interpretation placed on variables. We provide examples of errors from each group of journals, and a critical test of one highly-cited study. Specifically, we show that if hukou registrations are erroneously used to measure the local population, following existing practice, conclusions about driving forces for urban area expansion are reversed. We give recommendations for more careful use of China’s sub-national population and per capita data.
Time varying errors are... not good. They don't wash out in fixed effects.

Careful out there...

Monday, 16 November 2015

Free the data

Why can't New Zealand public data be as publicly available as American data? Here's a snip from my column from interest.co.nz:
Academics in New Zealand wanting to use individual-level publicly collected data to look at questions of public policy interest have two basic options. They can request a Confidentialised Unit Record File from Statistics New Zealand for the Census or other collected data series, or they can request access to the data lab to get closer to the raw data.
Where America makes its anonymised samples free for anyone to download, New Zealand restricts things. The application form requires that you only use the data for the exact purpose you specify and limits how you use it.
Sometimes it is worth the costs of making that application, but a lot of the time a researcher might want to run a very simple correlation test or check whether average outcomes differ between two groups, just to see if there is any reason to go any further.
And, a lot of the benefit of easily accessible public data is in simple myth-dispelling. A lot of newspaper columns make a lot of assertions that are testable – at least in principle. Debunking them is not worth the hassle when it requires a specific application and approval process – even though Statistics New Zealand is exceptionally helpful through those processes. 
If New Zealand followed the United States in providing simple and accessible confidentialised public-use microsamples of its large datasets, researchers could undertake the kind of exploratory data analysis that leads to bigger projects down the track. Sometimes, we need to let the data tell us which hypotheses to test – and we need access to the data to be able to do it.
But, a New Zealand researcher applying for access to a confidentialised unit record file has to promise never to use it for anything other than the purposes stated on the application form, to keep the data secure (using it on laptop computers is effectively banned), and to destroy the data at the end of the research project or at the end of the 12-month licence.
Where rich American data is available to anybody with a web browser and an internet connection, and similar New Zealand data is rather difficult to get and to use, is it any particular surprise that a lot of New Zealand academics, paid in part by the New Zealand government, use American data rather than the New Zealand data that New Zealand taxpayers have already paid to collect?
And that is the self-inflicted wound.
On one side we have rich data that could throw light on countless interesting public policy questions, excellently and expertly collected and curated by Statistics New Zealand.
On another we have an army of academics whose continued employment increasingly depends on landing refereed journal articles. Those academics chose to live in New Zealand rather than elsewhere, and many of them would love to use New Zealand data to shed a bit of light onto policy discussions that are too-often devoid of evidence.
In between the data and the researchers we have the Statistics Act 1975 that binds Statistics New Zealand. To make things even worse, Statistics New Zealand will not release an anonymised data set to any researcher not based in New Zealand. Researchers from around the world help Americans to understand how their country works because they have free access to American data. New Zealand hoards its data like Tolkien’s dragon guards its gold.
Just look at the ACS data and how easy it is to access. Go to IPUMS, set up a free account, click the box that agrees that you will use the data for good and not for evil*, and then you can use the same SDA interface for the ACS data that you're of course well familiar with from the US GSS data. You can run regressions on the 2013 ACS sample, or cross-tabs, within the web browser. To do the same thing in New Zealand, you would have to specify exactly what you wanted to do and get prior permission for each thing.

* There seriously is such a box.

Tuesday, 3 November 2015

Starting school

In New Zealand, every kid can begin school on the child's fifth birthday. There is then no particular birthday cut-off for schools, other than that kids might be stuck in Year 0 a little bit longer.

In much of the rest of the world, school starts on a particular date: if you turned 5 before some cut-off date, you're in; if not, it's another year of daycare, but you'll be one of the older kids in your class. This has consequences for timing of births.

New Zealand may be considering flipping to the "everyone starts on the same date" regime. And so you have the potential for a rather nice difference-in-difference study: none of the kids in the current cohort would have been born with parents anticipating school-start timing effects around a set start date, but if the regime changes, they will - in a few years. In the transition, there will be kids in one year who started on their birthday and others just starting on the set date.

If it happens, I wonder whether anybody will pick this up as a neat identification strategy.

Friday, 30 October 2015

CURF and turf

Here's what you need to do if you want an anonymised 1% sample of the US Census.
  1. Go to Google and type US Census 1% sample, click on link to the Census.
  2. Download each of the state files from the FTP site and merge them yourself. Or just check things out for one of the states. Whatever you like.
  3. Start mucking about to test whether your pet theory is plausible.
Here's what you need to do if you want an anoymised sample of the NZ Census, or a Confidentialised Unit Record File (CURF) of any of big Stats series:
  1. Go to Stats NZ's site, here.
  2. Follow the instructions below:

Application process

CURFs can be accessed through the following process. Please contact us if you need help at any stage:
  1. Complete the CURF application form.
  2. Statistics NZ will assess the application and will ask you to provide further information if necessary.
  3. If the application is approved: 
    • the appropriate CURF licence must be signed by a person authorised to sign on behalf of the researcher's organisation 
    • each researcher who will have access to the CURF must sign the appropriate researcher undertaking 
  4. The CURF is supplied to the lead researcher.  

Assessment criteria

All access to microdata is at the discretion of the Government Statistician.
Consideration will be given to applications for CURFs that meet the following criteria:
  • The research is for a statistical purpose. 
  • The researchers have a proven history of research, or will be supervised by someone with a proven history of research. 
  • The researchers have the support of the organisation that employs them (eg, government department, university, or independent research firm).
  • The organisation supporting the research is based in New Zealand.
  • The researchers for the project using the CURF are based in New Zealand.

Methods of access

Once the application is approved, CURFs can be downloaded via secure internet access. Researchers must keep the CURF secure and ensure that the CURF is only accessible to approved researchers. Researchers can use the CURF at their workplace but data cannot be stored on a laptop, memory stick, or other portable device. All copies of the CURF data must be destroyed at the end of the research project.
CURFs are licensed for a 12-month period. The researcher can request a licence extension at the end of this period if further use is required.
Note that you can only use your CURF for the purposes set out in Schedule A of your application. So if there's some other hypothesis you wanted to check out, you need to clear it first.

If you have a hunch about something and want to see whether it's worth further checking out, America makes it easy. In New Zealand, you need to make application, wait, make sure you specified exactly what you might want to do with it, then buy a desktop computer because your laptop isn't good enough.

And the government wonders why NZ social scientists, funded by the government, rarely bother doing work on NZ data. It's a pain in the ass. Sure, it's possible. But you have to bear reasonable fixed costs to test whether an initial hunch is worth following up.

Earlier this week, I was reviewing one of our researcher's projects. They'd cited an interesting bit of American data. It would have been dead simple to check whether the same relationship bore out in the New Zealand data - just a couple of cross-tabs. But it would take all that rigamarole.

Why can America manage to provide its anonymised samples to anybody with a web browser while we have all of this?

Thursday, 6 August 2015

Gay Marriage Data

The latest data on civil unions and marriages is out.

What do we learn?

  • Civil unions are far less preferred to marriage, both by same and opposite-sex couples. 
    • In no year did civil unions exceed one percent of the number of marriages for opposite-sex couples.
    • When gay marriage was recognised, the number of same-sex civil unions plummeted. Prior to September 2013, there were an average of 44 same-sex female civil unions per month, and 30 male civil unions per month. After, both dropped to an average of just over three per month.
  • Women like marriage more than men. 1360 female couples formed civil unions since 2006, and 1003 female couples have been married since 2013. 1001 male couples formed civil unions and 751 male couples married over the same period.
  • The average number of opposite-sex marriages in the two years prior to gay marriage was 5631 per month. In the two years since gay marriage, that dropped to 5479 per month. 
    • A t-test shows no significant difference from the before period to the after period. So gay marriage hasn't broken heterosexual marriage, or at least the difference isn't yet statistically significant. Doing it properly would require controlling for time trends, but I doubt would change anything. The time trend was slightly negative on the number of opposite-sex marriages prior to the change, and remained slightly negative after.

Tuesday, 23 June 2015

The languages of Omecron Perseii 7 and Omecron Persii 9

Since none of us can really affect political outcomes, it's generally irrational to pay too much attention to politics. On that measure, men are far less rational than women - or at least by the studies of political knowledge I've come across (two examples), and my own work on New Zealand.

This general finding is supported by a very different kind of method. Schwatz et al trawled through 700,000,000 words, phrases and topics provided by 75,000 Facebook volunteers. The authors were interested in personality differences and language. But the gender difference in propensity to talk about politics was stark. Here are the word clouds, sorted by gender. I apologise for the curse words.


At least in this Facebook sample, women talk disproportionately about relationships and feelings; men disproportionately curse, talk about sports and video games, and talk politics.

If we look at the topic clusters, women's focused on family and feelings (emotions, cute things, happiness, friendship, family/friendship); men's were politics, sport, war, video games, economics-politics, and cursing. Or at least that's my summary of each of the topic clouds. Within the central core, government shows up on the men's side; nothing policy-related shows up on the women's side. Or, at least, these are the words that are most *distinctively* associated with each gender. If somebody on Facebook is talking about the economy, tax, budget, the government, freedom, democracy, rights, or liberty, it's likely to be a guy - at least in this sample.

HT: Max Roser

Friday, 17 May 2013

The Price of Wool and Economic Growth

You know how most comments sections are, well, terrible?* Not this one. Gerald Silverberg blogs on the New Zealand 1951 GDP data point and the Reinhart-Rogoff mess. I'm going to leave refereeing on Reinhart-Rogoff to Justin Wolfers. But just look at the depth of wonkery that goes into a single cell in an Excel spreadsheet. Careful data collection and distribution is ridiculously undervalued.

Gerald tries working out New Zealand growth rates for 1946-1952, contrasting Maddison's data with others. The Reinhart-Rogoff data doesn't look like Maddison's. Then commenters, likely including at least one data maven from the bowels of the NZ bureaus, start helping out.

Commenter Oscar first points to an FT piece showing that Maddison uses calendar years while the Stats NZ series uses March years. Then Silverberg starts wondering whether 1951 was due to the waterside lockout or to the wool price boom, quipping:
Who would have thought that you would have to become an expert on NZ wool exports and labor relations in 1951 to decide if public debt affects economic growth.
It gets much much wonkier from there. Mark Sadowski provides a short history of the waterfront dispute and the wool boom:
I was convinced from the start of the HAP/R&R controversy that the New Zealand part of this story was explained by the 1950-1951 New Zealand Wool Boom and not the 1951 New Zealand Waterfront Dispute.

The 1952-53 New Zealand Yearbook shows that wool sales were 47.1 million NZ pounds in 1949-50, 107.5 million NZ pounds in 1950-51 and 52.7 million NZ pounds in 1951-52.

Most of this was caused by a change in price, not a change in output. The average price of wool rose from about 38 NZ pennies a pound in 1949-50 to 88 NZ pennies a pound in 1950-51 and fell back to 40 NZ pennies a pound in 1951-52. (There were 240 pennies to a New Zealand pound.) Production was about 298 million pounds in 1949-50, 294 million pounds in 1950-51 and 315 million pounds in 1951-52.

According to the HAP/R&R dataset New Zealand's nominal GDP (NGDP) was 1.101 billion NZ pounds in 1949, 1.396 billion NZ pounds in 1950 and 1.446 billion NZ pounds in 1951, so that was a substantial proportion of New Zealand's economy.

A good paper about the New Zealand Wool Boom is here.

I can't locate a free copy, nor can I save a PDF file I can cut and paste but I would summarize the episode as follows.

Demand for wool had been strong since WW II ended but supply had been unresponsive to elevated prices. When the Korean War started in June 25, 1950 there was an immediate elevation in the price of wool. Between that date and March of 1951 the price of wool went up two to three fold depending on grade (lower grades went up more, mainly because that was the kind of wool the military was buying). Demand wasn't simply driven by US military stockpiling as retailers actually used rising prices to induce even higher sales.

In January 26, 1951 the United States Office of Price Stabilization (OPS) imposed a general price ceiling measure designed to freeze the pre-war price-wage structure. The price ceiling on wool brought trading in Boston (the central US wool market) to a standstill and caused US participation in New Zealand wool auctions to more or less cease. This led to falling New Zealand prices until February 7 when an emergency exemption was granted to the US military through April 1. This caused prices to recover but once the exemption expired prices fell sharply. By June 1951 they had fallen by 50% and by March 1952 they had fallen a total of 70%.

Now, my sense from reading the history of the Waterfront Dispute is that it was less a strike than a lockout. The government brought in 3000 troops an unknown number of scabs to keep the dockyards running, and thereby crush the union.

The 1954 New Zealand Official Yearbook shows the Cargo Manifest Tonnage "cleared" (exports) fell from 1,163,934 tons in 1950 to 1,129,629 tons in 1951. It rose up to 1,173,577 tons in 1952.

In other words the mass of cargo moved fell by only 2.9% and rose by 3.9% the following year.

What about the actual value of exports? Exports *rose* from 183,752,000 NZ pounds in 1950 to 248,127,000 NZ pounds in 1951, and fell back to 240,561,000 NZ pounds in 1952

Wool exports rose from 74,653,000 NZ pounds in 1950 to 128,176,000 NZ pounds in 1951 and fell to 81,998,000 NZ pounds in 1952. Note that wool exports increased by over 70% in 1951 and amounted to nearly 52% of all exports that year.

So it would appear that the 1951 Dockyard Dispute had little effect on actual exports. [note: links tidied from source]
And all of this over one cell in a rather large Excel table. Raise a toast tonight to the wonks whose work provides every cell of every spreadsheet on which we rely.

* Except at Worthwhile Canadian Initiative, somehow.

Friday, 7 October 2011

CPI visualizer

Keith Ng rightly won an award for this one.

I can't embed it, but it lets you easily check out component increases in the CPI back through June 2006. So if you're a data visualization geek, or you want to better understand the components of price level changes over time, hit the link.

Here's one example. Just check the changes in the prices of tobacco products since the anti-Nanny State National Party took over from those horrible "I'll force you to do what's good for you" Labourites (hint - the first bar on the right to pass the 4% line is Q1 2009):


The image doesn't do it justice; the link above gets all the interactive stuff.

I'm particularly recommending it to our Econ 104 and Econ 105 lecturers for teaching our students about the CPI. Thanks Keith!

Friday, 18 February 2011

Lowering transaction costs

They could both be right:
Biderman is quick to explain why his business isn't hurting anyone. "You eradicate Ashley Madison, you're not going to eradicate infidelity. That's what allows me to sleep at night," he says. "If you think that all affairs happen on Ashley Madison, you're very naive. The majority happen in the workplace. People are thrust together, that's where they happen." In that context, Biderman likes to argue, affairs can be much more damaging, by causing meltdowns at work, becoming public, and blowing up marriages. Ashley Madison and its clandestine, more transactional approach, he says, is actually a marriage saver, a public service of a kind. "Do you think if you stop allowing divorce attorneys to advertise, we would stop people from getting divorced?" he says.

According to Justin Wolfers, an economist at the Wharton School of the University of Pennsylvania, Ashley Madison provides liquidity to an illiquid market, which may make the market bigger. "The labor market is all about workers trying to find jobs and jobs trying to find workers," Wolfers said. "In the romance market, technologies like the Internet are helpful in making those matchings more efficient, so if it makes it easier to find a mate, presumably it would create more of these ventures."
Ashley Madison reduces transaction costs by matching married folks with other married folks; incentives for discretion are ideally then the same for both parties. I'd expect this to be an otherwise fairly large barrier to trade; the folks at Ashley Madison saw the deadweight costs imposed by information asymmetries as potential profits to be earned.

It would be very surprising if innovations of this sort didn't increase the number of transactions. I'd expect the market otherwise to be rather illiquid; determining who's in the market could prove rather costly.

I'd also expect that the success of Ashley Madison will help out other online ventures.

I love the data that OK Cupid regularly puts out. It would be even more interesting if Ashley Madison started doing the same.

Thursday, 9 September 2010

True stereotypes

OKCupid has sorted half a million daters' self-descriptive tags by race, religion and gender. True stereotypes follow below, or at least statements true on average about the half million people in their dataset:
  • White men like guitar rock, cars, sci fi and comedies: broad theme, according to OKCupid: "Frathouse"
  • White women like bonfires, boating, horseback riding: broad theme, according to OKCupid: "escapism"
  • Blacks are far more religious - more than twice as likely to mention faith in their profiles
  • Black men like soul food, being cool, sports, god and rap music
  • Black women like soul food, The Color Purple, god and gospel music
  • Latin men and women love music and dancing
  • Latin men like to talk about their sense of humor and mixed martial arts
  • Asian men like their country of ancestral origin, Asian food, engineering and software development
  • Asian women like chocolates and romantic comedies
  • Indian men: cricket, hindi, a software engineer
  • Indian profiles showed the highest level of writing proficiency, followed by Asian and Middle Eastern.
  • Sorted by religion now:
  • And, the more serious you are about your religion, the worse your measured reading proficiency score, unless you're an atheist or agnostic. OKCupid asks whether there's a Comic Sans version of the Bible. Satoshi Kanazawa would be all over this: presumably in a US sample, atheism would be an evolutionarily novel idea and non-Christian background would be associated with pretty strong selection effects - the higher IQ parts of each religion's sample would be more likely to emigrate to the US.  There's at least a half grade level difference between Protestants and Muslims, favoring Muslims, and more than a full grade level difference between Protestants and Atheists.  Does Glen Beck make sense to you now?
OKCupid's blog remains one of the most seriously awesome data exploration sites out there.

Wednesday, 31 March 2010

Dating Data

I'd pointed previously to some of the excellent data analysis work going on over at OkTrends: the data blog of internet dating site OK Cupid.

They're now taking on ideology. They seem to have a version of the World's Smallest Political Quiz running: they have ideology data on 172,853 people. THEY HAVE IDEOLOGY DATA ON 172,854 PEOPLE. The heart races!

They use the data to plot out the age-path of average position in two-dimensional ideological space (libertarian from 18-22, leftie from 23-31, rightie from 32-53, then authoritarian thereafter), match it with relative importance of economic and social issues by age to get correlates of partisanship, then show some effects on dating. On the latter, economic (or social) conservatives [note: US terminology] tend to have high agreement with other economic conservatives on non-political issues; economic (or social) liberals, not so much. So it's easy for them to make matches among conservatives, but harder to get good matches for liberals. I'd expect this to be due to a stronger religious dimension to social conservative views that yields common answers on other questions; if economic and social conservatism are correlated, then we'd see (and do see) similar but slightly weaker results for economic conservatives.

I'll leach one of their graphs: go to their post for the full set.


I'd love to see a variant on their age-slider graph that would show densities across the space rather than just average position.

I also wonder how badly sample selection issues come in for the 30 and up bracket. Presumably folks drop from OK Cupid when they marry and only re-enter if they divorce (or are high risk to divorce); the sample of those in their 50s who are dating is going to be different from the full sample.

Massive props to OK Cupid for sharing some of this summary data. Awesome work guys!

Tuesday, 9 March 2010

Google Public Data Explorer

Google continues its general push towards all-round awesomeness with its new public data explorer.  Lots of data that can be visualized lots of ways.  For example, hit the play button below:

You'll see something strange start to happen in Washington, DC in 2006.  Roissy beware...

More standard economic datasets include World Development Indicators, OECD Factbook data, population, mortality....