Thursday, 16 June 2016

Selection gateways

Suppose you observed that kids who tried some risky-looking novel activity X were more likely to go on to try some other risky activity Y. Should you conclude that X leads to Y, or that kids who are risk-, sensation-, or novelty-seeking will exhibit that on more than one margin? Cohort selection effects matter: the ones who try X aren't a random sample from the population.

A few years ago, the Dunedin Longitudinal Survey found that early use of marijuana correlated with problems down the track; Ole Rogeberg argued, and further evidence later showed, that that was all selection effects. The kinds of kids who try marijuana early are not the same as other kids and would have different outcomes even if they didn't use marijuana.

Out this week in Pediatrics (supplementary materials here): a study showing that kids who use e-cigarettes are more likely to go on to try tobacco than kids who didn't use e-cigarettes as baseline.

Adjusting for gender, ethnicity, grade and highest parental education, those who'd used e-cigs at baseline were 6.2 times as likely to go on to try tobacco. I expect this will be painted as e-cigarettes being a gateway drug for tobacco. But kids who tried e-cigarettes at baseline will be different from other kids: even in the absence of any gateway effect, you would expect to find correlations between exhibiting novelty-seeking behaviour on one margin and exhibiting it later on another margin.

They note that controlling for number of friends who smoke, friends' attitudes toward smoking, and others in the household smoking had no appreciable effect on results, but that having tried cigars, pipes or hookah prior to initial evaluation reduced the odds ratio on e-cigarettes from 6.2 to 5.5. It would be interesting to see what would happen with other controls for baseline risk-seeking: age of initiation of sexual activity, any other alcohol or drug use, or even number of days' detention in the past year. It can be tough though to get additional controls through IRBs though. Some assessment of time preference could have been interesting too.

They do try to control for a measure of susceptibility to tobacco use. They asked the kids a series of questions like "At any time in the next year, do you think you will use these products?" or "If one of your best friends were to offer you these products would you use them?" A "definitely not" answer to 3 questions was taken to indicate that the person was not susceptible to smoking. Restricting the sample to those deemed susceptible reduced the odds ratio to 2.12.

Among those who'd answered "definitely not" to all three questions, those who used e-cigarettes at baseline were 9.7 times more likely to try cigarettes.

Again, you can tell two stories here.

You could say "Among those most emphatically saying that they wouldn't try cigarettes, those who tried e-cigarettes were at much greater risk of smoking".

Or, you could say "There's a strong social desirability bias around smoking; few people are willing to admit they might ever try cigarettes. 79 kids didn't completely rule out ever wanting to try cigarettes, and most of them used e-cigarettes at baseline. 216 kids gave emphatic no answers, and of those, far more of the e-cigarette users went on to try tobacco. If admitting you might try cigarettes is shameful, is it surprising that those kids who were more sensation-seeking to begin with, as demonstrated by using e-cigs at baseline, were more likely to smoke despite having said they never would?"

It would have been interesting to see whether a set of susceptibility questions around risky drinking would have revealed similar patterns between e-cigarette and non-users on follow-up.

Mike Siegel has a bit more to say on it here:
This study is virtually meaningless in terms of its evaluation of the “gateway” hypothesis.

Baseline e-cigarette use was defined as ever having taken even one puff of an e-cigarette. And smoking initiation was similarly defined as ever having taken even one puff of a cigarette. So the study did not document that even one subject in the study was evera regular vaper. It is entirely possible (and in fact likely) that the majority of these kids had experimented with e-cigarettes, failed to become vapers, and then turned to regular cigarettes. In fact, it’s entirely possible that had these kids been able to stick with vaping, they would never have become smokers.

In addition, the study counted anyone who had even puffed a cigarette as being a smoker. So theoretically, a subject could have had a single puff of an e-cigarette and hated it, and then had a single puff of a cigarette and hated it, and they would be considered someone who initiated smoking because of first becoming addicted to vaping.
However, they did find that e-cigarette users were 5.5 times as likely to have initiated smoking but not to have smoked in the past 30 days, and 7.5 times as likely to have reported cigarette use in the past 30-days. If regular smokers are more likely to report having smoked in the past 30 days, then it isn't just the single-puff problem driving things.

I'm more worried about underlying cohort heterogeneity that is far from adequately controlled by asking kids whether they think they might ever take up smoking.

Tuesday, 14 June 2016

The happiness of lowered expectations

The police and medical officers of health seem to be trying to block alcohol licence applications, not because of any fault or deficiency of the licensee, but because they just don't like the idea of anybody selling alcohol.

And so in a victory measured against lowered expectations, the police only managed to reduce the hours of the new Countdown supermarket's alcohol sales. They can only sell beer and wine from 7am to 8pm.

We usually do our grocery shopping after the kids are to bed, so around 9pm. I'm very glad that Khandallah's New World grocery isn't under similar restrictions.

There can be real nuisance caused by drunken students. Sprawling suburban campuses can internalise that by having halls of residence away from the university's borders, with ample on-campus drinking venues so the students don't stray too far. That's harder for urban campuses.

If Kiwi students are anything like we were in Manitoba 20 years ago, well, an 8pm closing time for beer and wine won't make a whit of difference.

The campus bar was connected by underground tunnels to the residence hall where I lived for my first two years at the University of Manitoba; it was rather convenient when it was otherwise -40 outside. The closest place to buy beer was about a 20 minute walk up to Pembina Highway, and who wants to carry a couple of 24s that far? You pretty much had to drive if you wanted to find liquor. But whenever a big weekend was coming up, somebody would drive over to the liquor store in the afternoon and buy a ton of booze. And a guy on our floor did home wine-making in one of the closets; he had a five gallon bucket of fermenting fruit. Occasionally, somebody would do a run down to North Dakota to come back with Everclear, which made absolutely no sense but seemed like a good idea at the time.

I think a lot of people are engaging in a lot of wishful thinking about how an 8pm closing time for one beer and wine outlet will prevent students' drinking. Do people forget that quickly what being a student is like?

Monday, 13 June 2016

Soda taxes when discount brands exist

Which of the following sounds more like the real world?

In world A, you walk down the grocery aisle. You want to buy some soda. You see that the price of your favourite brand of soda has gone up. You decide not to buy any soda and you consequently drink less soda.

In world B, you walk down the same aisle with the same intention. On seeing that the price of your favourite brand of soda has gone up, you look around to see if it's available at a lower price point in cases of cans, or if a different comparable brand is available, or you give the discount brand a second look. Or, you decide to hold off that week because you still have some stored in the cupboard from last time it was on special and you can buy a few cases next time it's on special. Either you spend a bit less to drink the same amount of a discount brand, or you don't spend anything this week but still drink about as much as you otherwise would have because you're drawing down your stocks.

Turns out that most of the studies that try to estimate the effects of soda taxes assume we live in world A. I live in world B, and suspect you might too.

Waikato Professor of Economics John Gibson provided a superb presentation on the problem at the Ministry of Health at lunchtime today.

How effective a fat or soda tax is at curbing consumption depends on how responsive people are to changes in prices. If people are not very responsive to changes in prices, taxes will not do very much to change consumption.

Most measures of price responsiveness depends on very poor data. For example, in New Zealand, studies will use the Household Economic Survey's measure. The HES provides an income share measure: what proportion of your weekly family expenditure went to fizzy drinks, or to meat, or to any of a wide variety of other categories. That, combined with a price series on the average price of sodas, is used to get an assumed measure of quantities consumed. So when average prices go up, total family expenditures on the fizzy drink category get divided by a higher average price. The change in quantity consumed then comes out of that.

But while that can work well if the product is very specifically defined, like "6 pack of 330mL cans of Coke Zero", it stops working if the category is "fizzy drinks". Why? People respond in two ways to price hikes. They can reduce the total quantity consumed, but they can also change what they buy: shifting from more expensive products to packaging that costs less per unit (say, an 18-pack of cans instead of a single can for a lower unit price), or shifting from a more expensive brand to a store brand. All of the HES-derived figures assume zero change in the quality of what is purchased and consequently assume all of the movement is on the quantity side.

John points out that this is hardly a problem unique to New Zealand. Hundreds of studies do this and consequently overestimate the actual responsiveness of quantity to prices. Economists at least are typically well aware of the problem: it's been pointed out at least as early as 1955.

Deaton proposed a potential solution - which was about as good as you could get without direct observations on all of unit values, prices and quantities. Under a few restrictive assumptions, you can estimate quality changes by looking at the unit prices paid by households of different incomes.

Gibson uses data from Vietnam where they have unit values, budget shares, and prices for 45 food and beverage groups to look at how biased price elasticities are when they don't control for changes in quality. Using the standard method, Gibson found price leasticities around -0.8. Correcting properly for quality changes, which his data lets him do, measured elasticities dropped to about -0.20. In other words, the true price elasticity of demand is a quarter of what typically gets reported. And while the Deaton solution helps somewhat, remains pretty far off.

Here's the key slide. The "Unrestricted elasticity of quantity with respect to own-price" shows Gibson's elasticity estimates that recognise quality shifts - again, this is only possible where you have all the data, and we typically don't. The second line shows the price elasticity you'd get if you used the standard method which assumes that nobody makes changes along a quality dimension when prices change. The third line gives the elasticity measure you'd get using Deaton's method.


Here are John's slides from his presentation.

Your bottom line: sugar taxes will probably do about a quarter as much as you might have previously thought in changing consumption. Sure, this is data out of Vietnam, but note that opportunities for quality shifting are larger in richer and more developed economies, because there will be more brands at more price points. And where opportunities for downshifting stop if you're already on the lowest possible price point because you're very poor, that constraint will bind less in richer places.

And worry too that all of this still overestimates the price responsiveness of consumption as compared to purchases where people can store durable goods like soda.

Jenesa pointed to these problems in her report, citing Gibson's then-in-progress work. There's a lot of wishful thinking in the public health sector. One prominent public health researcher/activist (Chatham House) argued at the MoH presentation that even if taxes didn't change behaviour that much, they still could be worth trying as they can't really do harm. Where do you start....

Crossposted from The Sandpit

Stadium follies

If you're going to build a stadium, don't do it in hopes of boosting GDP.

Sam Richardson ably surveys the international literature before weighing up the effects of stadium construction in New Zealand.

He finds:

  • There's a short term boost to construction activity during the stadium build. He reckons Wellington had 56 more full-time-equivalent construction jobs during its build. 
  • But, there's no effect on regional GDP, even during construction, barring some effect from arena builds as compared to stadiums.
He concludes:
The results from this analysis suggest that predictions of substantial economic impacts of sports facilities have generally not materialised. Optimistic predictions need to be tempered, with particular attention paid to the existing facility landscape. There are several reasons why economic impacts fail to materialise, many of which have been mentioned in the literature review section of this paper. A short-term increase in construction sector employment for certain facility types appears to exist during construction; however the effects largely disappear post-construction. Real GDP is generally unaffected during the construction of facilities and during the post-construction period. If the intention of local government funding in such projects is to stimulate employment or GDP, projects that generally do not deliver anything more than short-term sector-specific impacts would not appear to be appropriate. 
Local policy-makers should also be mindful of other potential impacts, in particular the opportunity cost of subsidising facilities. It has been noted elsewhere in the literature that a change in employment composition resulting from subsidising facility projects could potentially bring about a worsening in economic development. If a facility project results in the creation of low-skill employment at the expense of high-skill employment, the host area may well experience a deterioration in economic development relative to other areas (Baade & Dye, 1990).
If you want to spend a pile of money throwing a party, or building a place for such things, justify it on those grounds - not on potential effects on GDP.

I wonder if Sam will turn his eye to convention centres....

Thursday, 9 June 2016

Whatever the problem, inequality's to blame

Man, the snake-oil salesmen of the 1800s had nothing on today's inequality campaigners. Turns out that inequality's to blame for New Zealand's low organ donation rates. Really?

Here's Eileen Goodwin at the ODT.
An "individualist new-right'' attitude that holds sway in New Zealand is holding back organ donation rates, a University of Otago biomedical ethics authority says.

Prof Grant Gillett was contacted for comment on a Ministry of Health consultation process that seeks to increase New Zealand's low rate of organ donation.

Prof Gillett supports a shift to an opt-off organ donation system that would involve families in the decision-making process.

He said the political ideology of the Ministry of Health and the Government hindered efforts to foster a different view of organ donation.

"The ministry's got quite an individualist new-right sort of agenda.

"I think it's shared by the Government at large; I think that's the reason why we are encouraged to tolerate the inequalities [in society].''

"It's fundamental to neoliberalism that every individual should be able to be accountable for their own stuff, wrapped up in their own life, and not have dues to others.''

... Asked if countries with high economic inequality had lower organ donation rates, Prof Gillett said he did not know.

"To do that you would need to look carefully at Scandinavia.''
That second-last line's a kicker. Any evidence that MoH is actually a den of neoliberalism? No. Any evidence that inequality affects organ donation rates? No. Gillett knew inequality was to blame before he even opened up the data tables. Great stuff, but he's a biomedical ethics authority.

I'm grateful that Eileen Goodwin got in touch for a response. She quotes me below:
Contacted for a response, Dr Eric Crampton, head of research at right-wing think-tank The New Zealand Initiative, said the link between income equality and organ donation seemed "tenuous''.

"America's organ donation rate far exceeds Sweden's and New Zealand's, but Spain beats both. Inequality does not seem to enter into it. If we want more organ donation, we need better incentives around organ donation,'' Dr Crampton said.

Dr Crampton said New Zealand could follow Israel's lead and put willing donors at the front of the queue when they needed an organ themselves.
I ran some very very rough correlations using Wikipedia tables on deceased donation rates and World Fact Book tables on Gini: neither are great, but it was what I could grab in 15 minutes yesterday afternoon.

The very rough correlation coefficient between inequality and donation rates in a cross-section of European countries plus the US was about 0.07: slightly positive, but nothing that you could conclude anything from. I put zero stock in it, because doing it properly would require at least a panel study to pull out country-level fixed effects that could simultaneously drive inequality and organ donation, but at least on the face of it, there is no there there on inequality and organ donation.

Doing it even more properly would start with data on individualistic attitudes from the World Values Survey.

I should have pulled the Irodat data. Here's the table for deceased donation rates. If you can see any inequality pattern in there, your eyes are better than mine. France and the US have ballpark identical deceased donation rates. So do Ireland and Finland. And New Zealand's rate beats Greece's. Estonia is a poster-child for market-oriented reforms; its donation rates are higher than lefty Italy.


And here are the rates for live donors.


Amazing that the socialist transformation of man away from individualism in Venezuela still has their live organ donation rates lower than those in that every-man-for-himself dog-eat-dog Hong Kong, never mind the US. And Sweden is also lower there than the US.

Israel really shines in live donor rates with its combination of proper compensation for live donors and a guaranteed front-of-the-queue position if you're a live donor who later needs a transplant; effects on deceased donation haven't been as great as we'd have hoped. That's in part, it seems, due to perceived easy cheating on deceased priority where you get the priority card while you're alive, but somebody raises a religious objection and gets you out of it when you've died. That kind of cheating breaks reciprocity norms and erodes confidence in the system.

Eileen quoted me accurately. My full comments were below, but she took the right excerpt.
“If New Zealand wants to increase its organ donation rate, it needs to improve the compensation paid to live organ donors. Chris Bishop’s member’s bill will make progress on that front. Donors bear real costs when they take time out of work to help save a life and should not be out of pocket for having done so.”

“To increase donations from deceased donors, New Zealand should look to Israel’s example. In Israel, those who are willing to be donors have priority over those of similar medical need who are not willing to be donors. Family members affirming a loved one’s wish to be a donor should the time come also have priority. And live organ donors have priority so that they should never find themselves at the back of the queue that they already helped to shorten.”

“Countries with opt-out systems for organ donations have slightly organ donation rates than opt-in countries, but the benefits of switching can be overstated. Whether the New Zealand system were opt-in or opt-out, doctors believe themselves required to seek the family’s consent to any donation. So the real barrier then is in ensuring that people agree to be donors and that they inform their families about their wishes. Ensuring priority for donors can encourage people to be donors, and encourage families to respect the donor’s wish.”

“Links between income inequality and donation rates seem tenuous. America’s organ donation rate far exceeds Sweden’s and New Zealand’s, but Spain beats both. Sweden beats the UK, but the UK beats Denmark. Inequality does not seem to enter into it. If we want more organ donation, we need better incentives around organ donation.”
I've no particular problem with opt-out instead of opt-in but I have a hard time seeing big gains from it where the doctors would, regardless of opt-in or opt-out, go and ask the family for authorisation. Either way, final say is with any family member who might veto.

FWIW, I've signed my organ donor card. I'm also a member of LifeSharers and hope that my organs could be directed to another LifeSharers member should one be a suitable tissue match.

Elizabeth Prasad's report for the Initiative on the economics of organ donation is here.

My prior posts at Offsetting on the topic are indexed here.

Wednesday, 8 June 2016

Asymmetric Information

The latest issue of the NZAE newsletter, Asymmetric Information, includes Bryce Wilkinson's excellent critique of the Treasury's recent 'Living Standards' framework, along with a reply from Girol Karacaoglu. 

Bryce writes:
Yet high quality fiscal and regulatory analysis is difficult. For a start, politically powerful or influential spending and regulatory advocates might not welcome it. It is also difficult technically. The mainstream technique for analysing both regulatory and fiscal proposals is cost-benefit analysis.4 Treasury is the custodian of that methodology in the public service.5

Given these gatekeeper roles Treasury can’t expect to be widely liked, but it should aspire to be respected. It should not confuse the two.

Yet the Living Standards Framework does appear to want to be all things to all people. It proposes evaluating spending and regulatory proposals from five ad hoc perspectives–their contributions to economic growth, equity, sustainability, reducing risk and enhancing social infrastructure.

The framework apparently leaves it open to spending and regulatory interests to cherry-pick amongst the five pillars and within them, deciding for themselves which pillar best serves their purposes in a particular case. It gives no disciplined guidance to Treasury officers or anyone else as to how to choose between, say, competing concepts of equity, or how to assess trade-offs between the pillars. 6 Nor is there an international literature to look to for guidance.
Girol's reply follows.

You can read the Living Standards working paper here if you're particularly keen. Bottom line seems to be that if you assume a bunch of external costs from activities and that the living standards framework can internalise those external costs, then the living standards framework is a good thing. For example, if we assume that clean tech requires skilled workers, then you might not have enough investment in education if environmental quality is valued. For more such insights, but with a lot more math, you can read the paper.

Asymmetric Information also includes a regular feature profile of a local economist; I'm interviewed in this month's newsletter. So you can read that too if interested.

Thursday, 2 June 2016

Tobacco excise: running the numbers

Our BODE3 Programme Team have developed and published on a tobacco forecasting model (4,5). Running this model for the newly proposed programme of increasing tobacco tax by 10% each year until 2020 will see tobacco smoking prevalence reduce to 21.4% for Māori and to 8.9% for non-Māori by 2020 (compared to 22.7% and 9.3% if this taxation programme had not continued beyond January 2016 – see Figure 1). Assuming a continuation of ‘business-as-usual’ patterns in smoking uptake and cessation thereafter, the model suggests that prevalence will further reduce to 17.3% and 7.2% by 2025 for Māori and non-Māori respectively. Furthermore, the additional four rounds of tax increases have the potential to reduce the absolute ethnic gap in smoking prevalence observed in this country by nearly 1 percentage point in 2020 (ie, from 13.4% to 12.5%). In reality however, we suspect that annual tax increases are now so well accepted by NZ politicians and the public that this programme would actually be extended beyond 2020 when this year is reached.
I’m not going to dispute these figures at all; they line up with the ballpark figures I keep in my head on things – or at least through 2020. The price elasticity of demand for alcohol is about -0.4; the participation elasticity of smoking is about -0.2 or -0.25. The numbers here through 2020 are definitely in the ballpark I’d expect from a 40% increase in excise where excise starts at about 60% of the current price of a pack of smokes. The numbers through 2025 would be tougher to attribute to excise as more of the work there is being done by the continued decline in youth smoking uptake which would happen regardless of tax, and Wilson does not provide the counterfactual “what smoking in 2025 would be absent the tax” number (though the gap between the curves in 2020 isn’t much different from the gap between the curves in 2025).
But let’s think through what they mean.
By 2020, Wilson projects that excise will have cut smoking rates among Maori from the 22.7% he would have otherwise expected to 21.4%. So for every 1000 Maori in 2020, 13 who would otherwise have been smokers will not be smokers because of excise. That’s good for them, presuming that they wanted to quit and are happy that excise helped them to do so – which we’ll grant for now.
On the flipside, for every 1000 Maori, you have 214 smokers who will be paying a lot more for their cigarettes than they otherwise would have been paying.
The 2015 excise rate is $668.51 per 1000 cigarettes, or $13.37 per pack of 20 cigarettes. Suppose each smoker smokes a half a pack a day: 10 cigarettes. Each is then currently paying $2440 in tax per year. Does that number seem very high when smokers are heavily concentrated among the poorest? It should give you a bit of pause.
That tax is scheduled to increase now by 10% per year for four years: a 46.4% increase (assuming it compounds). The tax rate per thousand cigarettes would then be $978.70, and the annual excise on a half-pack-a-day habit would be $3572.25.
We should not expect that smokers would maintain current levels of consumption if prices increase. If we go with a standardish price elasticity of demand of -0.4,* and if the cheapest cigarettes currently are $18.80 for a pack of 20 Easy brand, and if we assume 100% excise pass through to get the biggest cuts in consumption possible (unrealistic), then the price of that pack of 20 will increase to $25. A 46.4% excise hike results in a 33% increase in the actual price of cigarettes (as about $5 of an $18.80 pack is the tobacco currently). Each smoker would then cut consumption by about 13%, so a 10 cigarette a day habit would drop to 8.7 cigarettes. Let’s round to 9 when we recognise that some people do smoke more expensive brands currently and will save money by shifting to a lower price point.
So for every 1000 Maori, we have:
  • 773 who would not have smoked regardless,
  • 13 who quit because of the tax and enjoy health benefits, save some money, and may or may not be happier from having quit – we’ll assume happier,
  • 214 who keep smoking about 90% as much as they had been smoking. Each and each pay about $1020 more in excise per year than they otherwise would have paid.
For every Maori smoker who quits, 16.46 Maori smokers will pay a bit over a thousand dollars more in excise per year – assuming they start with a half-pack-a-day habit. Some will pay more, some less. The 2014/2015 NZ Health Survey says that Maori daily smokers smoke on average 10.3 cigarettes per day, so that’s about right. On the other side, the same survey says that current prevalence of daily smoking is 35.5% among Maori. If Wilson’s figures underestimate baseline smoking in 2020, then the tax hike would have a few more current smokers quitting than here estimated, and a lot more current smokers paying that extra thousand bucks per year.
The NZ Health Survey notes that daily smoking rates are 25.4% overall in the most deprived neighbourhood quintile (as compared to 8.3% in the least deprived quintile). MoH estimates there are 178,000 daily smokers in the most deprived quintile. If each of them is pays an extra $1000 in tax, the government is pulling $178 million more dollars out of our poorest communities.
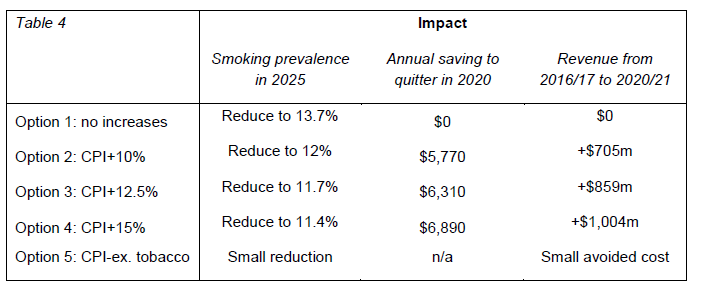
Table3 RIS
The government expects another $700 million out of this.
There are currently 546,000 daily smokers, or at least by the 2014/15 latest figures. Some will quit. The government expects to get $1282 per current daily smoker (or $1157 per smoker including intermittent smokers). Since some will quit, the burden per non-quitter, on these estimates, suggest my figures above understate the true figures – assuming Treasury’s done a more careful job of things than my spitballing out of Nick Wilson’s numbers.
We can pretty confidently state that smokers who continue, which will be the vast majority of smokers, will be paying over a thousand dollars more per year for their habit, and that these smokers are heavily disproportionately poor.
The quintile household income boundary for the bottom quintile in 2014 was $21,300.** If a bottom quintile household has one smoker in it, $1000 per year is 4.7% of that household’s annual income. That’s an overestimate of the effect in 2020, because incomes in the bottom quintile will have increased by then. If we extrapolate the average annual increase in that quintile’s real income since 2001 through to 2020 from 2014, income would be about $23,285, and the $1000 in excise increase would be 4.3% of that household’s annual income. But remember that this is just the increase in excise. The total burden of tobacco excise on a bottom quintile household’s income where that household has one smoker on a half-pack a day is about 13.8%.
Meanwhile, it remains illegal to sell nicotine-containing vaping cartridges in New Zealand. You might think that if health policy were about health, rather than about loading taxes onto marginalised and politically weak groups, we’d have had an announcement about legalising vaping rather than pulling $1000 more per year out of poor smokers.
The greatest*** trick the devil ever pulled was convincing people that tobacco excise is good for the poor because the health benefits are progressive. You can get those same progressive health benefits simply by legalising vaping, without the ridiculous regressive burden. Where even this massive tobacco excise hike only has trivial effects on quit rates relative to the counterfactual, and huge effects on household incomes for the poor, vaping doesn’t have to achieve all that high a penetration rate to be far far more effective than excise.
Another fun fact: where benefits tend to be CPI adjusted, they use CPI not inclusive of tobacco prices.
I wanted to run some of these numbers because I’m heading this afternoon into a pre-record for Radio New Zealand’s Sunday Morning programme. Along with me will be the excellent Marewa Glover, and Tony Blakely. Tune in on Sunday….
* A -0.5 figure is often used for consumption, but I’ve already accounted for participation elasticity, so I think I’m being conservative here.

*** Ok, among the greatest.