Thursday, 10 November 2022

Watching Mediawatch

Massey University's Journalism school put out a survey of the nation's journalists. 

Mediawatch's story on it focuses on gender and ethnic diversity, as well as journalists' reports of taking abuse online, after an opening that casts things this way [updated to insert link that I forgot the first time round...]:

These days, there’s no shortage of the same sort of scepticism – and cynicism – among a group of New Zealanders convinced the media are biased and agenda-driven, even without any firm evidence.  

Cranky claims of pro-government media bias have been amplified by increased public funding of media and journalism under this government, twinned with declining trust in the media and journalists as captured by opinion polls and surveys.

... One startling finding from the latest survey was that when journalists were asked whether "supporting government policy" was part of the role of reporting,10 percent agreed. 

Does that not confirm the suspicions of critics who feel that the media isn't impartial and journalists are often biased?

“There's always going to be journalists that think their role is to change society and advocate for one thing or another," Hollings said. 

"It may be that sometimes that aligns with government policy. But there's a difference between journalists actively propagandising for a particular point of view and doing the ‘watchdog role’ of asking difficult questions about something that's going on.

"They can often be mistaken for having an agenda when their agenda is really to find out what's going on – and not necessarily to push a political party. I think one is sometimes mistaken for the other and it's easy to label a journalist as being an activist who is, in fact, just asking difficult questions which some people don't like."

With that kind of opening, you'd expect that the survey either found no evidence of ideological or partisan bias among journalists, or didn't ask about it. Surely the claims are only 'cranky' if they aren't borne up by the evidence right?

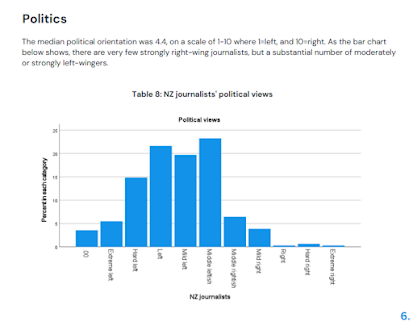
They helpfully link through to the study at least, so you can check for yourself. And here's an interesting chart.  

For some reason, RNZ's Mediawatch decided that this chart, showing that there are more self-identified extreme-left journalists as there are "Hard Right", "Right", and "Mild right" combined, and that "Hard left", all on its own, outnumbers everything to the right of "Middle leftish" by a massive margin, wasn't worth noting. 

Probably just an innocent oversight by the always politically and ideologically neutral team at Mediawatch. 

Thursday, 3 November 2022

Bracket creep basics

My fortnightly column for the Stuff papers shifted from Mondays to Sundays. This was in this past week's Sunday Star Times:

If you want to know the effects of small changes to tax rates or tax thresholds on government revenue, the Treasury provides a handy calculator. But the calculator breaks if you ask it to tell you the effects of inflation on tax revenues since April 2021, when the new 39% tax rate came in.

It warns, “The change is too large for this model to give a realistic estimate of change in tax revenue.”

Parliament did not legislate for a tax increase large enough to break Treasury’s tax calculator.

Nobody proposed it. Nobody campaigned on it.

It never went to Select Committee for deliberation. No tax experts analysed the distributional consequences of it or its affordability.

It never received Royal Assent. Parliament simply failed to undo that which Adrian Orr gifted it, at our expense.

Imagine if Parliament had increased taxes across the board when it introduced the 39% rate. The $14,000 threshold would be reduced to $13,000. The $48,000 threshold would drop to $44,000. The $70,000 threshold for the 33% rate would go down to $64,000. And the 39% rate would apply to incomes over $164,000 rather than $180,000.

Discussion about whether people earning $65,000 should face a 33% tax rate might have been heated.

Thanks to the Reserve Bank of New Zealand having forgotten about its one big job while pursuing other trendy objectives, $70,000 today is worth the same thing as $64,000 in April 2021.

I went through a few more of the numbers on bracket creep. Susan Edmunds followed it up with a couple more stories on tax and inflation.

One of the more depressing kinds of responses to these stories is argument that inflation pushes government costs up too so all's fine. Think about it this way. 

Imagine we had a 30% flat tax that covered everything and government had a balanced budget. If inflation pushed everything up in parallel, no worries: government collects 30% of the bigger income figure, and its costs go up by the same amount, so it all works out.

Now flip it so that the two-thirds of the population face a 25% tax rate and the top third pays 35% on their last dollars earned. And that the income distribution is such that government collects the same amount of revenue as it would have collected from a 30% flat tax. Run inflation in that model and you aren't just getting 30% of a bigger number, you're getting more dollars taxed at that higher 35% rate. Government revenue goes up extraproportionately.

Afternoon roundup

Today's closing of the tabs:

Life expectancy and health outcomes

There's a literature on everything, so I expect someone's already done this. I'd be keen to see the result if someone has.

There are almost-certainly piles of disorders that are particularly damaging when you're older rather than younger, and where there are apparent differences in effect by ethnicity after correcting for age. 

I know that the Ministry of Health here has pointed to differences in Covid outcomes by ethnicity in multivariate analysis correcting for age but there will have to be lots of other ones.

There are two ways of thinking about age. You can think about it as years since birth. Or you can think about it as percent of expected life expectancy already expended. Same as how you can think about your fuel tank as how many litres of fuel you've used since you filled up, or as what percentage of the tank is left. 

Suppose that life expectancy at time of first birthday varies by ethnicity for whatever mix of environmental and genetic reasons. Fuel tanks vary in size. If you're counting litres of fuel used since the tank was full, there will be very different amounts left in the tank depending on the car. 

And suppose further that the true effect of some disorder on health outcomes depends on your remaining life expectancy before the disorder hit rather than your time since birth. Basically anyone who's at 95% of their life expectancy is going to have a rougher time with the illness regardless of whether that 95% mark hits at age 67 or age 80. 

If that's the underlying process, if you run a regression with health outcomes on the left-hand side, and age-in-years and ethnicity on the right-hand side along with whether someone catches the disorder, you're going to lump effects into ethnicity that might not really belong there for this particular disorder. 

It'll be true that a greater proportion of people with this ethnicity at that age die of the disorder, but the ethnicity variable will be a mix of underlying differences in mortality risk by ethnicity plus disorder-specific risks.

I'm not trying to criticise the MoH work here. I'm just wondering where this kind of thing has been considered in the literature. Do age-ethnicity interaction terms sort it out by allowing the effect of age on health outcomes to vary by ethnicity? MoH throws in a "hospital-registered co-morbidity" variable that will catch some of the 'effectively old for physical age' effect but wouldn't get all of it.

I just keep remembering that old Robert Fogel work looking at the health status of US Civil War enlistees, where the 50-year-olds of the 1850s were hitting the health problems of today's 70-year-olds. It'd be true to say that 50-year-olds of that era were at far higher risk of dying from heart attacks. But they were also way closer to end of expected life expectancy. So it wasn't just that heart attacks were worse then - it was that life expectancy was lower, people effectively aged more quickly, and something like a heart attack is worse when you're more run down. 

Other not-so-fun bit from that old NYT piece on the Fogel work, that could also be relevant these days:

Dr. Almond had a problem with the studies. They were not of randomly selected populations, he said, making it hard to know if other factors had contributed to the health effects. He wanted to see a rigorous test — a sickness or a deprivation that affected everyone, rich and poor, educated and not, and then went away. Then he realized there had been such an event: the 1918 flu.

The flu pandemic arrived in the United States in October 1918 and was gone by January 1919, afflicting a third of the pregnant women in the United States. What happened to their children? Dr. Almond asked.

He compared two populations: those whose mothers were pregnant during the flu epidemic and those whose mothers were pregnant shortly before or shortly after the epidemic.

To his astonishment, Dr. Almond found that the children of women who were pregnant during the influenza epidemic had more illness, especially diabetes, for which the incidence was 20 percent higher by age 61. They also got less education — they were 15 percent less likely to graduate from high school. The men’s incomes were 5 percent to 7 percent lower, and the families were more likely to receive welfare.

The effects, Dr. Almond said, occurred in whites and nonwhites, in rich and poor, in men and women. He convinced himself, he said, that there was something to the Barker hypothesis.
Thursday, 27 October 2022

Inflation

Newshub did a roundup on OCR and inflation after the latest Stats release had inflation higher than expectations. 

Robert MacCulloch is disappointed the piece didn't mention monetary policy. 

For what it's worth, here's the full comment I'd sent through to them - they didn't pick up the monetary bit at the start, alas. They'd asked about whether the Bank should be doing stuff beyond OCR, so I spent a bit more time on that. But I opened with monetary because, well, duh.  

“Inflation is the result of too much money chasing after too few goods and services. The global response to the pandemic involved substantial monetary easing, while the pandemic made it more difficult for firms to supply goods and services. Reserve banks internationally failed to update their policies quickly enough. Today’s inflation figures are the result of errors made a year or more ago in inflation forecasting and monetary policy. And the consequences of current tightening will be felt perhaps a year from now. 

In normal times, interest rates are central banks’ main tool for inflation targeting. If the Bank expects that, a year from now, too much money will be chasing after too few goods, raising the interest rate reduces demand across the board. Investment projects, whether in construction or otherwise, that made sense at lower interest rates make less sense at higher interest rates. Increasing interest rates means the Bank does not have to pick and choose where to try to reduce demand, which would be terribly fraught. 

The pandemic involved a few non-traditional monetary responses. The Reserve Bank engaged in substantial quantitative easing, meaning it purchased lots of bonds using new money. It also provided a subsidised loan facility to the banks through the Funding for Lending programme. It makes little sense to be increasing the cost of borrowing through the official cash rate while continuing to facilitate bank borrowing through the Funding for Lending programme. It is scheduled to end in December.

The Reserve Bank is now in a rather difficult spot. It is not crazy to expect global recession in the next year through the combination of global monetary tightening and the effects of the war in Ukraine. Energy prices in Europe all on their own are likely to spark recession there. A central bank expecting global recession would not normally want to be tightening monetary conditions. 

But both inflation and inflation expectations have been becoming unhinged. Earlier this month, the Reserve Bank released the results of a survey undertaken as part of its Remit Review. Less than 5% of respondents said they were “extremely confident” that the Reserve Bank would get inflation back within its target range by 2024. About 20% of respondents were “somewhat confident”. And about sixty to seventy percent of respondents were either “not at all confident” or “a little confident”. 

It means that the Bank not only has to fight inflation but also has to fight to restore confidence in its commitment and ability to achieve its target. A Bank with stronger inflation-fighting credibility could afford a more cautious approach in response to global uncertainty. 

The government could make the Reserve Bank’s difficult job easier by moving more quickly to balanced budgets, and ceasing spending programmes like Enviro-Jobs that had been initiated mainly as make-work in 2020. It is exceptionally unhelpful for the government to fund make-work programmes when private employers are starved for staff. 

The government could also consider signalling, clearly, that the next Governor of the Reserve Bank, to be appointed next year, will be strongly committed to the Bank’s inflation target rather than continuing to divert the Bank into areas far from its core business.”

I'd also suggested a couple times last week, on RNZ's morning report, and in my slot on Nights, that Adrian Orr should not be reappointed and that Minister Robertson should, quickly, very clearly signal that Orr's successor will take a far more traditional view of the role of a Reserve Bank. 

Oxfam misrepresenting inequality, again

The simplest explanation is probably the correct one. Oxfam writes dodgy reports on inequality because it works. Dodgy reports yield sensationalistic headlines, which drive donations to Oxfam.

You may remember Oxfam for annual dodgy reports on wealth inequality that typically try to tally up how many billion people have net wealth of less than a top handful of people. As Tim Harford pointed out years ago, his friend's daughter, who just received her first fifty-cent piece, had higher net wealth than about two billion people who have negative or no net wealth. Anyone finishing university with student debt, and who hasn't been gifted a pile of wealth by their parents, will be listed as having less net worth than a subsistence farmer in whatever most-destitute place you want to pick. Why? None of the figures count the value of the degree. It's all nonsense. 

Noah Smith fisked it over at Bloomberg in 2019; I've had a running series on these things too. Oxfam's numbers are designed to mislead. 

And journalists keep getting suckered by them. How can Oxfam help but be a bunch of humbugs when so many people want to believe things that are not true? Tom Hunt turned Oxfam's 2019 numbers into a front page story in the Dom, without any thinking through whether the numbers make any sense. It was quickly apparent that the main action for NZ was in currency movements, and that Oxfam's source, the Credit Suisse report, showed declining wealth inequality in NZ in any case.

But zero NZ journalists bother to check. Because it's Oxfam right? Don't they do good things abroad? Why would they lie, consistently, about the statistics?  

Earlier this year, Oxfam put up another one claiming huge increases in global poverty. Noah Smith went through it fairly comprehensively. Bottom line, Oxfam was just inventing huge numbers. And then Noah reminded everybody that "Oxfam is a serial repeat offender of dodgy statistics". 

So. When I saw a Newshub headline on a new Oxfam report claiming New Zealand's tax system is ranked 136th in the world in reducing inequality, I groaned. Not again. I hoped that nobody else was going to pick it up. The number was surely so obviously stupid that nobody other than Newshub might run with it. 

But then the Herald ran it. And the interview kept conflating wealth inequality and income inequality and making weird claims about the need for a wealth tax when that wouldn't even move the Oxfam measure, which only counts income, consumption, and company tax. 

So I had to go through it. 

You can read it at Newsroom. The data for it is here - the Google sheet pastes in the Oxfam tables, the OECD tables, then runs the comparative rankings. 

The points should be obvious to readers here:

  • Looking at any tax in isolation is a mistake; Oxfam complaining about GST being regressive is 1) wrong; 2) stupid because it's part of a progressive tax system. 
  • Looking at tax in isolation of transfers is even stupider. Imagine two countries. One runs fifty different income tax schedules depending on your household circumstances. The other runs one income tax schedule and then transfer programmes that depend on your household circumstances. You can design the two to yield identical results. But if you rank countries by tax system on its own, you'll wind up saying stupid things. 
  • The OECD data has NZ middling of 37 countries when assessed on tax and transfer. We start with low(ish) market income inequality and we wind up with middling after-tax-and-transfer income inequality. Take the difference as a percentage and NZ's tax and transfer system is 18th of 27. Middling. Like should be obvious to anybody who's ever looked at this freaking data. 
  • Any ranking of the inequality-reducing powers of tax systems that puts the US ahead of Sweden, and Costa Rica ahead of either us or the Swedes - how can you believe anything in the report if you see that? What's wrong with you? In the OECD data, Costa Rica starts with the highest market inequality among OECD-ranked countries, and still has the highest income inequality after tax and transfer, and has the system that does the least to reduce income inequality regardless of whether you measure it as a Gini-point difference or as a percentage reduction in the initial Gini measure. And Oxfam had Costa Rica ranked more than a hundred places above New Zealand. Even if you don't know anything about Costa Rica - how could you miss that they've ranked the US ahead of Sweden? Don't American and Kiwi social democrats constantly yearn to be more like Sweden? Think about it for half a second. 
Oxfam reports are like those email scams that put in deliberate typos and grammatical errors so that only the most credulous people believe them, so they don't have to waste time with people who'll wise up part-way through. 

But then I have to waste time going through them, because people still for whatever reason still trust newspapers.

Maybe the coming "let's ban disinformation" thing will ban Oxfam reports so I won't have to do this anymore. 

Tuesday, 25 October 2022

Afternoon roundup

A closing of some of the browser tabs: